

Key Takeaways:
- Bitcoin’s taker buy/sell ratio signifies a rally ahead, says CryptoQuant.
- The long-term holder SOPR points to the same bullish direction.
- 30-day volatility fell below 20, another historically bullish indicator.
YEREVAN (CoinChapter.com) — The Bitcoin market has dropped hugely in Q3/2023 due to a flurry of headwinds, including the Binance liquidity scare, China’s Evergrande fiasco, and the continuous quantitative tightening policies globally.
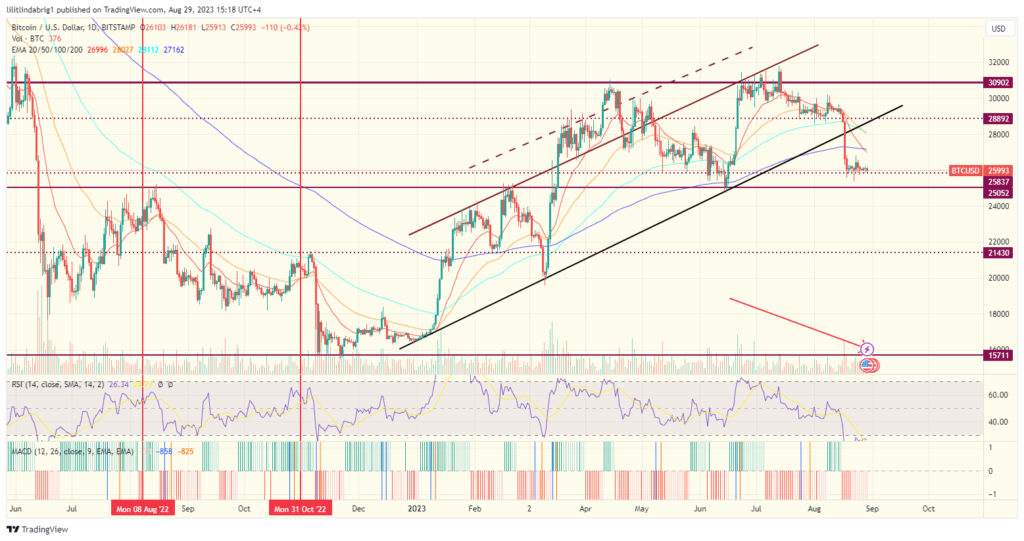
However, several on-chain metrics indicate an upcoming rally and signify that the current price stall is a consolidation phase before a bullish push.
#1 Taker buy/sell ratio spike = bull run?
According to an on-chain analytical platform, CryptoQuant, a taker buy/sell ratio spike has occurred on the BitMEX and Deribit exchanges.
In detail, The taker buy/sell ratio is the ratio of buy volume divided by the sell volume of takers in the perpetual swap market, futures-like derivative contracts with no expiration date, allowing traders to speculate on the value of the underlying asset.
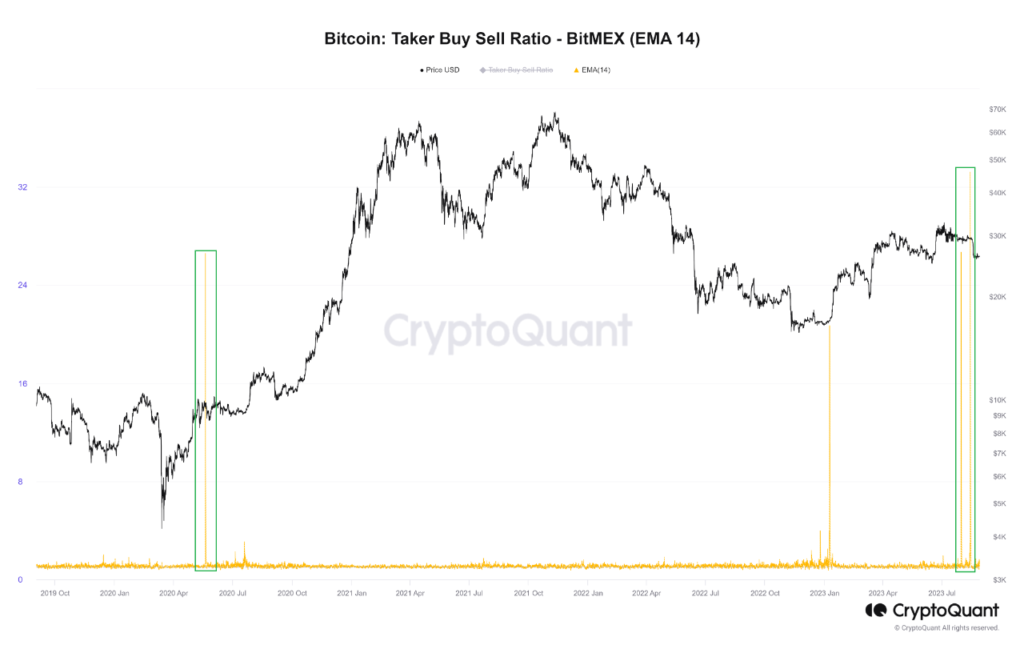
“Given the prolonged consolidation after the price increase, the current situation resembles the consolidation phase seen after Covid-19, indicated by the green-boxed area,” commented the CryptoQuant researchers.
#2 Long-term holder SOPR gearing up for a move above 1
The long-term holders’ spent output profit ratio (SOPR) indicator spelled a bull run ahead.
In detail, the SOPR estimates whether the distribution of spent transaction output is in profit. It is calculated as the dollar value of spent outputs at the spent time (realized value) divided by the dollar value of spent outputs at the created time (value at creation).
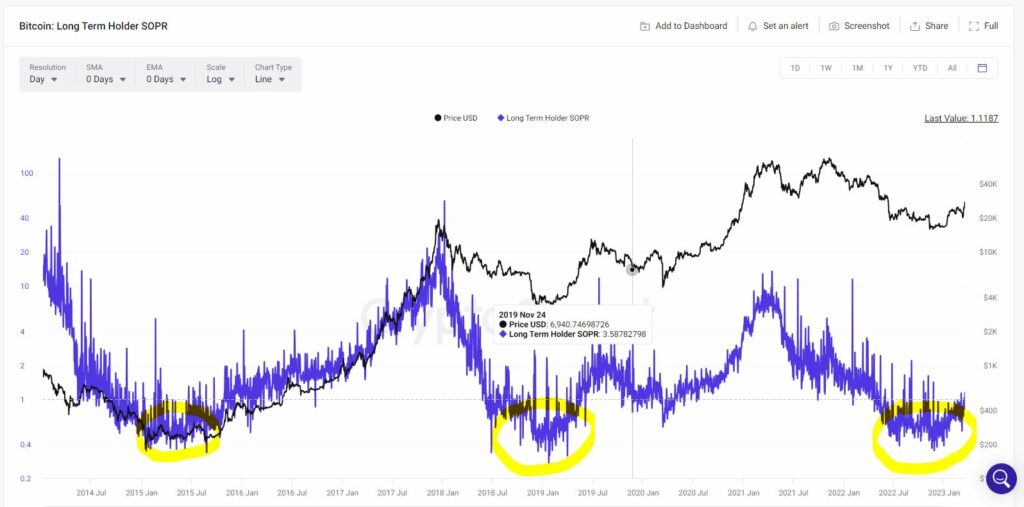
According to CryptoQuant, higher-trending SOPR implies that holders realize their profits, and coins that were in profit are transferred to others. As the chart above shows, Bitcoin’s long-term holder SOPR has increased to 1 since January 2023 but remains fairly low.
Additionally, moves above the said line accompanied the previous two bull runs in 2016-2017 and 2019-2021. Its current reading implies that the coins moved in a certain timescale are, on average, selling at break even. This means that long-term investors will likely wait for a more profitable price to sell.
#3 Bitcoin’s 30-day historical volatility below 20
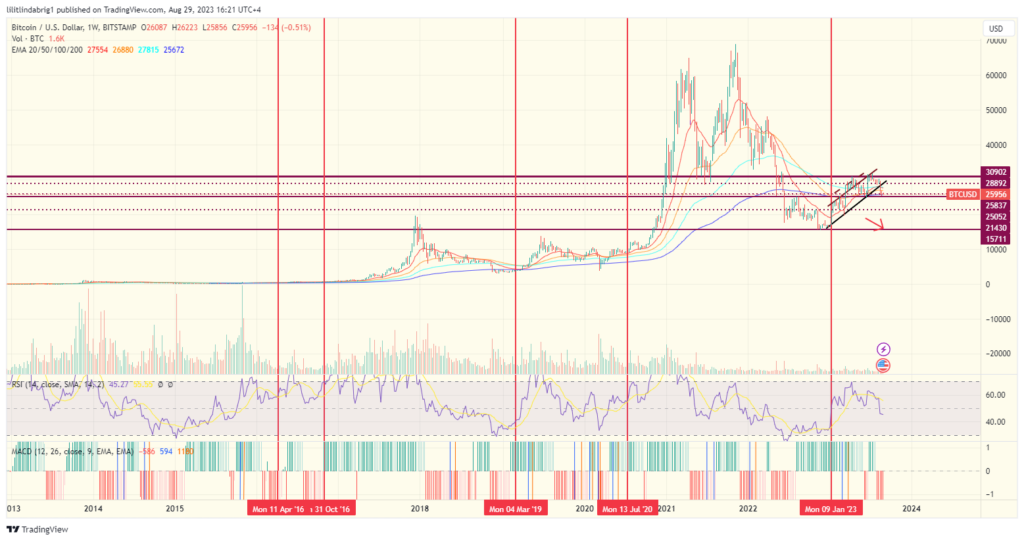
Raoul Pal, a veteran investor and the CEO of the financial media platform Real Vision Group, noted another instrumental metric in his latest newsletter. Pal asserted that Bitcoin’s 30-day historical volatility moved below 20 for the first time since the start of the year.
According to the analyst, the metric has historically set the scene for Bitcoin to go on a huge run in the succeeding months.
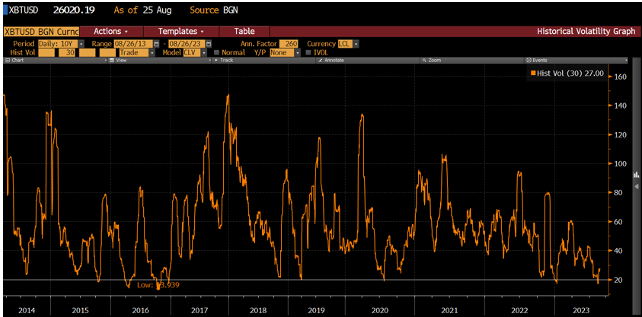
After a strong start to the year (60% to 100% rise), the crypto markets have been completely dead over the summer…This 20-level has always produced huge moves over the subsequent two to four months…
he commented.
Pal then offered historical examples of the aforementioned phenomenon per the chart above.
In April 2016, the low volatility resulted in an 83% BTC price increase in two months. In October 2016 – an 85% rally in two months; in March 2019 – up 214% in three months. Similarly, in July 2020, BTC pumped 102% in four months, and in January 2023 — up 85% in three months.
Notably, the flagship crypto is still vulnerable to the bearish factors noted above. However, if the on-chain metrics are correct, another bull run could hit the markets by 2024.
The post 3 Bitcoin On-Chain Indicators Predicting BTC Price Bullish Reversal appeared first on CoinChapter.


