

YEREVAN (CoinChapter.com) – Bitcoin struggled below $20,000, trading at $18,900 early on Sep. 24, after a choppy weekly performance. However, analysts predict a further tumble for BTC, as low as $17,500 in the upcoming sessions. Here are the main reasons behind the outlook.
#1 Correlation with USD liquidity
CoinChpater has informed its readers about Bitcoin’s correlation with the risk-on assets on multiple occasions in the past quarter. Meanwhile, the said correlation is not only true for Bitcoin – Nasdaq 100 pair but also for the USD liquidity index, a money supply indicator. Given the Fed’s determination to raise short-term interest rates for the foreseeable future, Bitcoin’s prospects don’t look bullish at all.
Arthur Hayes, the co-founder of investment company 100x Group, provided a chart that illustrates the lockstep between Nasdaq 100, USD liquidity index, and Bitcoin.
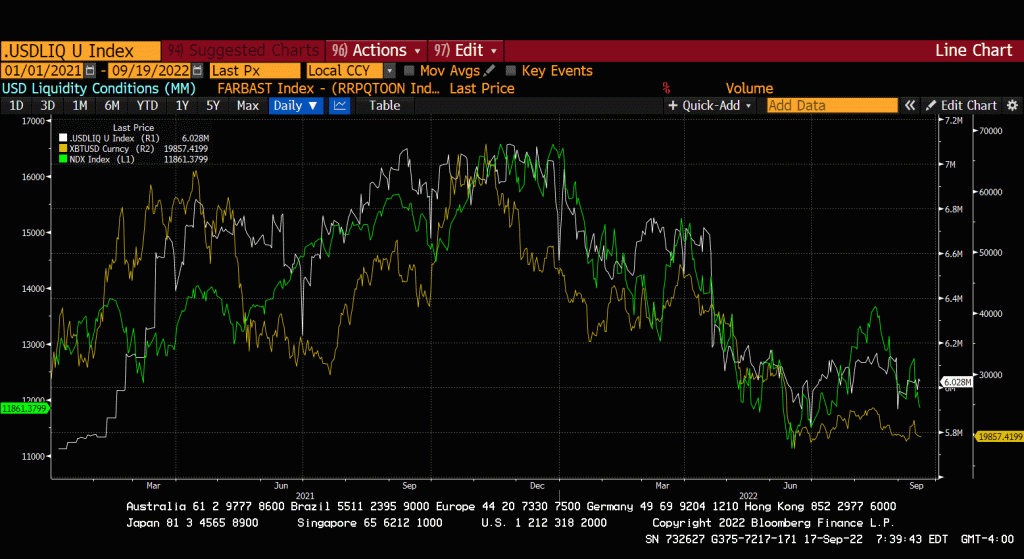
But the correlation by itself doesn’t give much incentive to future BTC price action. Instead of the absolute value of the index, the analyst based his prediction on the “liquidity situation today relative to the situation in the recent past” or the “impulse” of the index.
I settled on a 3-month index. The components of the index are updated weekly (The Fed Balance Sheet and Treasury General Account) and daily on weekdays. There are usually 252 trading days a year in America, so if I want a 3-month impulse, I’m talking about 63 trading days.
commented the expert.
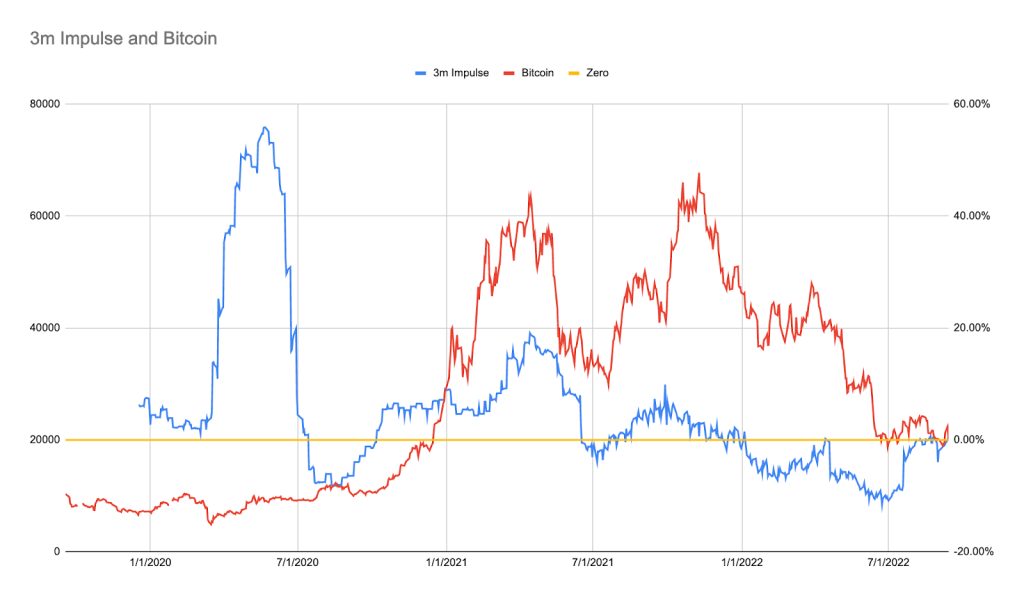
Hayes commented that he does not place all his hope on one indicator. However, very simply, “if the impulse is positive, I’m happy being long Bitcoin,” said the expert. And if the impulse is negative, “I’m happy either not having a position or being short Bitcoin.”
Meanwhile, the USD liquidity index greatly depends on the overall geopolitical climate across the globe, which is red-hot with possible additional outbreaks.
#2 Geopolitical headwinds
The war in Ukraine has already cost thousands of human lives, millions of displaced civilians, and once thriving cities that have been completely ruined. Moreover, it rippled far beyond Ukraine itself, caused an energy crisis in Europe, heightened inflation across the globe, and could further irritate dormant conflicts in other regions.
The most prominent examples of the implications resonate in the Caucasus region, in the possible China vs. Taiwan attack and the US government’s willingness to intervene in both.
While it is hard to foresee the exact chain of the upcoming events, one thing is certain. The USD liquidity index cannot take any more strain.
The EU, the tip of the anti-Russia / China spear, cannot survive a strong USD when they must now import many more LNG tankers filled to the brim with all-American natural gas. This shindig is also after the US midterm elections, and thus the political will to “fight” inflation is likely to fall quicker than TerraUSD.
said Hayes.
#3 Bearish Technicals for Bitcoin price
It seems only natural that Bitcoin technicals would not show much hope for the bulls in these tough times. The technical analysis suggests that BTC/USD could fall further, breaking below the $17,000 margin for the first time since Nov 2020.
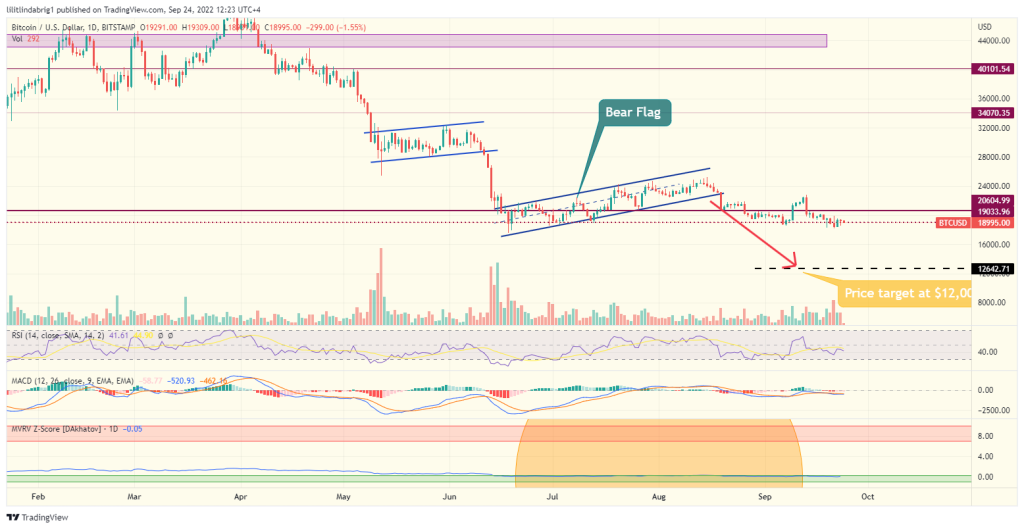
In short, as CoinChapter reported earlier in Q3, BTC formed a ‘bear flag’ setup, which entails a period of a moderate upside move after a sharp decline. The formation panned out on Aug 19, when BTC broke below the channel’s support. Moreover, a bear flag forecasted a subsequent decline, equal to the drop preceding the setup. Thus, the target price for Bitcoin would stand at approximately $12,000.
The post 3 reasons why Bitcoin price could crash below $17.5K appeared first on CoinChapter.


