

YEREVAN (CoinChapter.com) – Bitcoin investors enjoyed a 70% year-to-date profit as the BTC/USD exchange rate bottomed out at $16,500 on January 1 and charted around $28,000 on April 4.
However, the bulls might not have much time to celebrate, as the flagship crypto is primed for a bias reversal. Here’s why.
#1 Long-term holders’ on-chain data bearish
According to the crypto analytical platform CryptoQuant, exchange deposits of long-term Bitcoin holders (18 months to three years) can help forecast its future price fluctuations. For example, recent research claimed that the small bull run of 2019 ended when holders who bought BTC at the 2017-2018 highs deposited their coins onto exchanges.
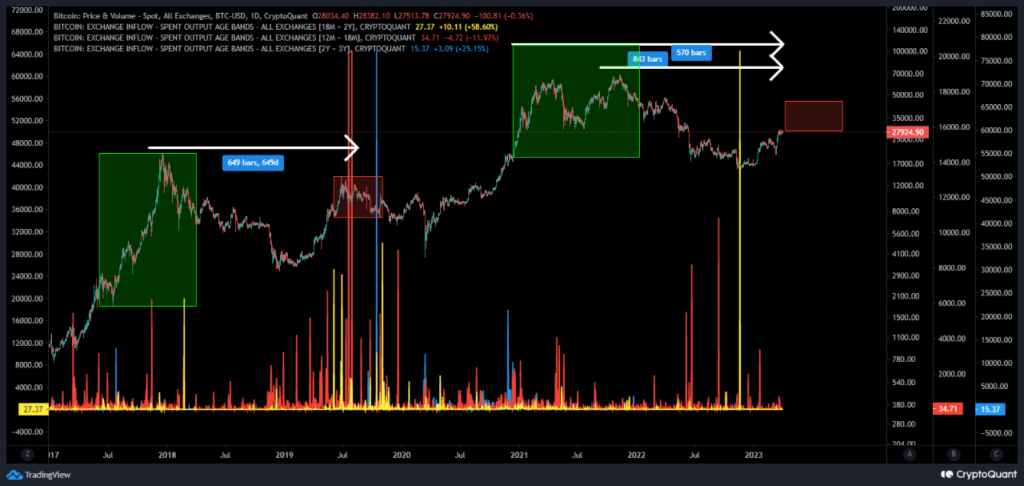
We believe that this small bull market will end when long-term holders who bought at the 2021 highs start to deposit on exchanges. Keep an eye on exchange deposits of Bitcoin held for 18 months to 3 years. Fortunately, there is no sign of a sell-off from long-term holders yet.
concluded the research.
Also read: Bitcoin Price Loses Momentum And It’s Vulnerable to a Drop Below $27K.
However, the long-term holders’ spent output profit ratio (SOPR) indicator spelled trouble. The latter estimates whether the distribution of spent transaction output is in profit. SOPR is calculated as the dollar value of spent outputs at the spent time(realized value) divided by the dollar value of spent outputs at the created time(value at creation).
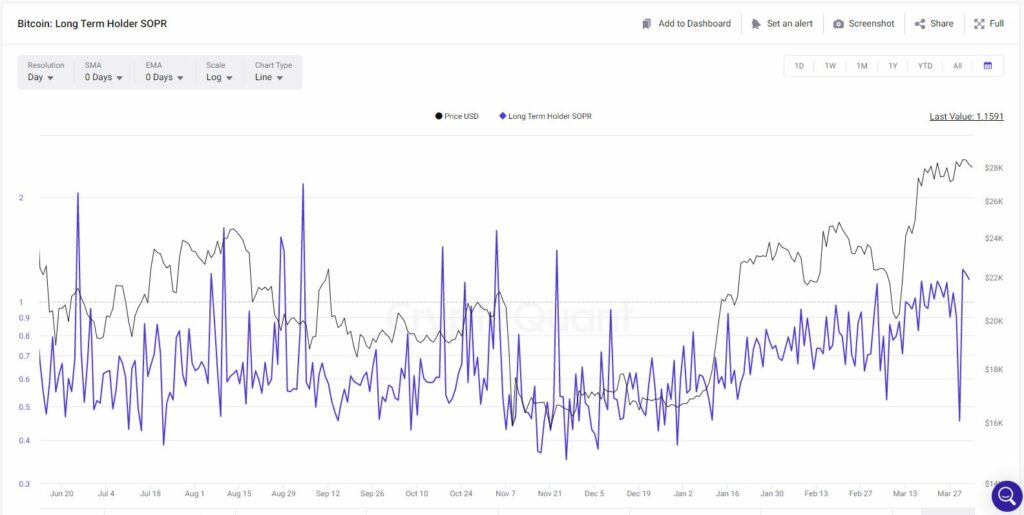
According to CryptoQuant, higher-trending SOPR implies that holders realize their profits, and coins that were in profit are transferred to others. Also, SOPR above one, as in the chart above, could mean that “investors who sell their coins in profit are increasing their sell or market condition for sellers are getting more profitable.”
#2 Declining number of Bitcoin whales
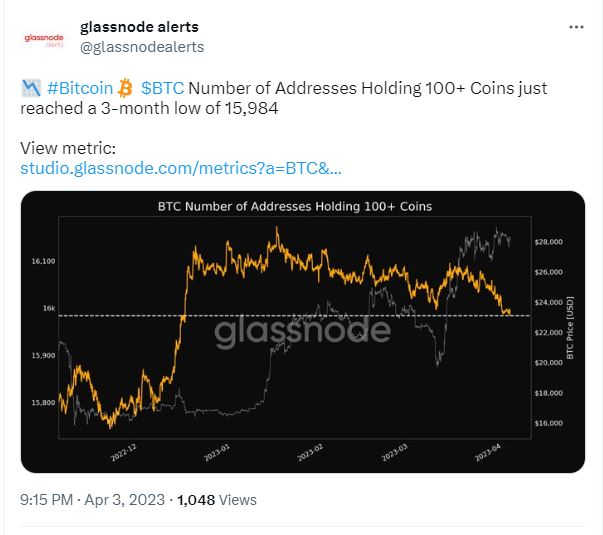
According to another analytical platform Glassnode, the number of Bitcoin whales, i.e., addresses holding over 100 BTC, has reached a three-month low of just below 16,000 wallets.
CryptoQuant backed the conclusion, singling out the large whales holding between 1,000 and 10,000 BTC. As of March 29, the large whales increased the selloff pressure on the market, and smaller traders are likely to follow.
[The whales’] daily spending increased above 320K bitcoin, which reached 34%, a percentage of total BTC being spent, the highest since Dec ‘22. Due to this selling pressure, we are witnessing a divergence between price (increasing) and whales’ BTC holdings (falling to the lowest since early February).
read the statistics.
#3 Bearish technicals
The BTC/USD price action also faced divergences from the relative strength index (RSI) and the trading volumes. In short, while the price action has been establishing higher highs since mid-January, the RSI printed lower highs. Such deviation predicts a looming price decline.
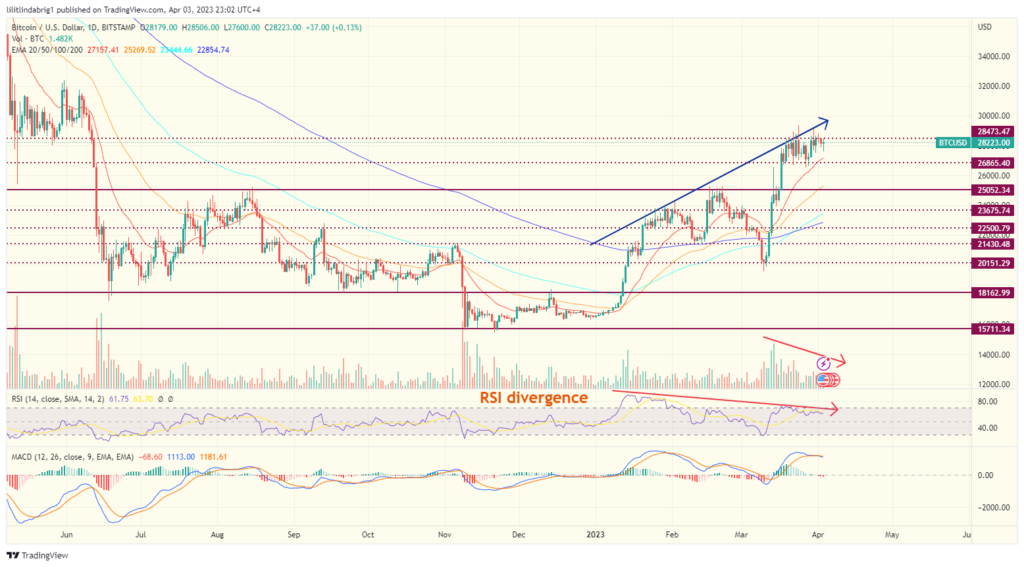
Additionally, the trading volumes have declined since March 14, while the BTC price has jumped 28% in the same period. The flagship crypto repeatedly retested a support-turned-resistance of nearly $28,500, backing the bearish narrative.
Also read: Why is Bitcoin Trending Amid Violent Protests in France?
The post 3 Reasons Why Bitcoin Won’t Cross $30K in Q2 appeared first on CoinChapter.


