

Key Takeaways:
- Bitcoin price broke above $28,000 for the first time since Aug. 2023.
- BTC on-chain metrics suggest a bullish investor sentiment.
- The token has formed bullish technical patterns.
NEW DELHI (CoinChapter.com) — Bitcoin (BTC) price dropped more than 4% after reaching its two-month high near $28,560.
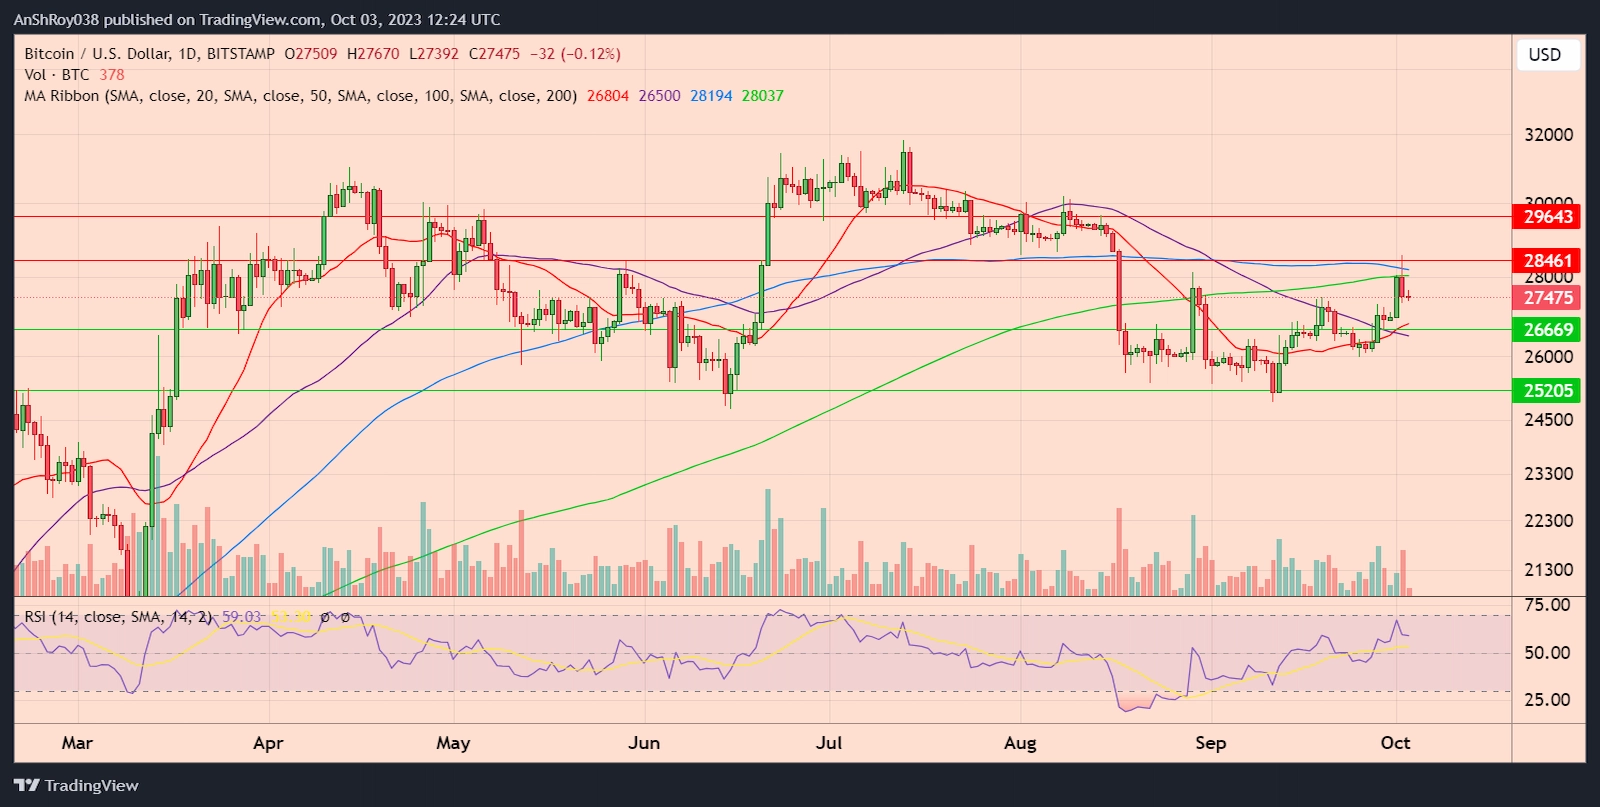
However, the cryptocurrency shows the potential of continuing its price rally throughout October. Here are three reasons why.
#1 ‘Uptober‘ Effect On BTC Price
October has a historical track record of being a bullish month for crypto, earning the nickname ‘Uptober.’
Yet, it remains unclear what spurred Bitcoin price to spike to its highest in over a month. Traders might have viewed the launch of several ETH futures ETFs on Oct. 2 as a positive sign for the wider crypto market.
Citi Bank strategist David Glass stated in a client note that trading volumes for the token have been low.
Despite low volumes, traders are bullish on Bitcoin’s potential. Crypto trader Rekt Capital predicted a $29,600 price for BTC in Oct. 2023 with a 10% rally.
The US government avoiding a shutdown likely boosted investor sentiment. Crypto trader Max Keiser suggested that Federal Reserve rate hikes might not effectively control inflation and could push Bitcoin prices higher.
Pro-Bitcoin US Senator Cynthia Lummis warned her followers that the government was on the verge of a “debt death spiral that will bury future generations.”
The FUD from the economic stress could drive users towards the crypto sector to hedge their savings.

Meanwhile, speculations and hype are also favoring Bitcoin. Leaked internal documents from Microsoft revealed the software giant had plans to include a crypto wallet on its Xbox roadmap for May 2022.
However, Phil Spencer, head of Xbox, played down the leaks, stating that plans had already changed. Nevertheless, the speculations likely acted as fuel for the BTC price spike.
Honda has partnered with FCF Pay, a payment platform accepting cryptocurrencies, including Bitcoin, ETH, and BNB. This partnership allows customers to use their crypto tokens, albeit indirectly, for leasing, financing, or purchasing Honda vehicles, showcasing increasing crypto adoption in the automotive sector.
BTC Price Moving Inside Two Bullish Patterns
Another bullish cue for BTC price comes from the token moving inside a bullish pattern called the ‘Falling Wedge.’
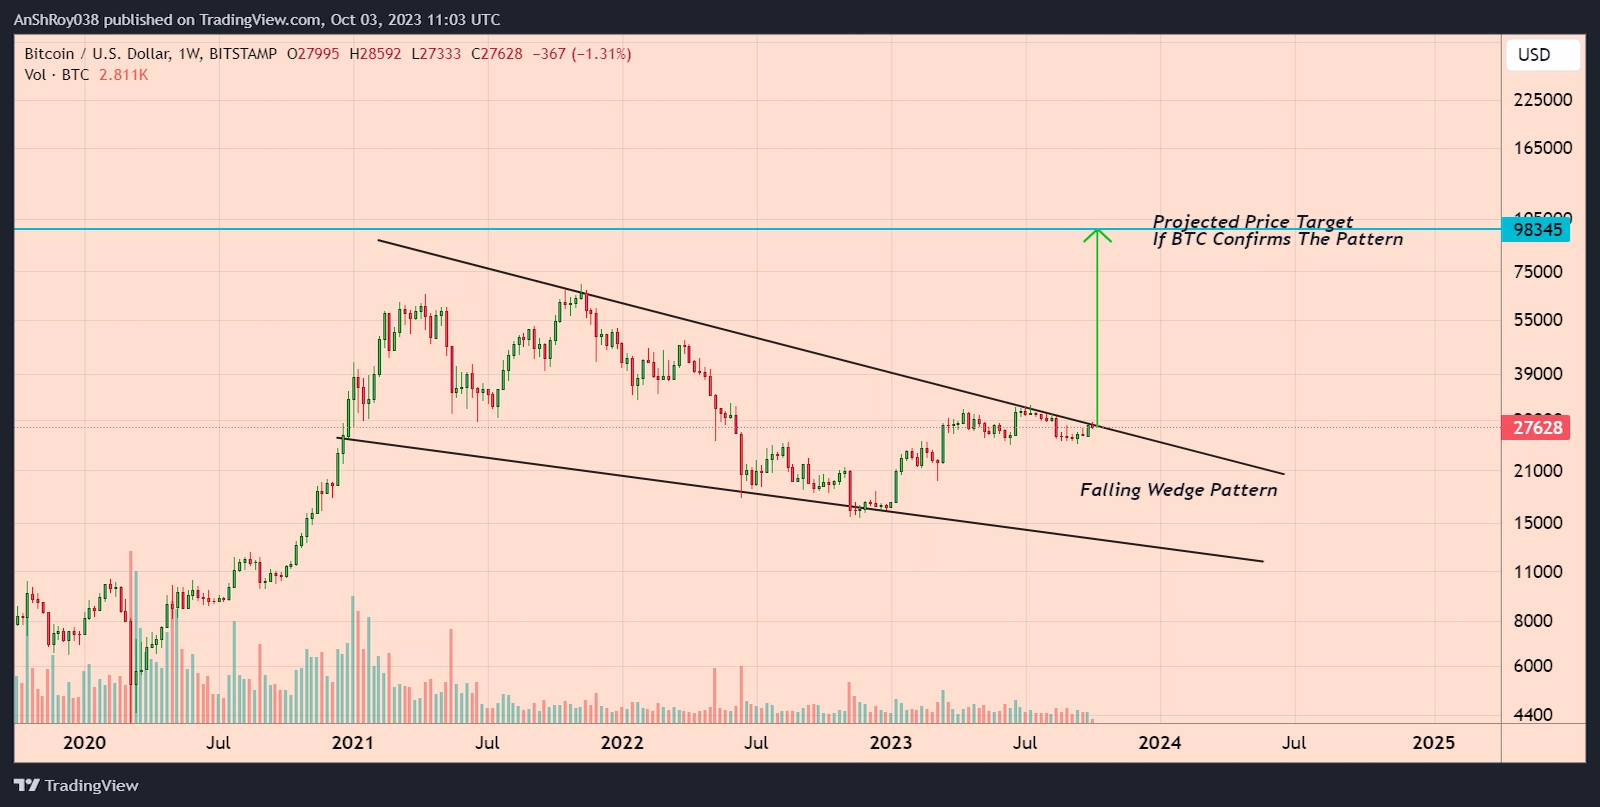
A technical pattern called a falling wedge forms as the price fluctuates within converging downward trendlines, often leading to an upward breakout. A key feature is declining volumes as the trendlines converge.
The upside target for the breakout is equal to the maximum distance between the falling wedge’s upper and lower trendlines. Thus, confirming the pattern could theoretically see the BTC price rally 256% to reach the pattern’s calculated price target of $98,345.
Moreover, zooming in on the chart shows that Bitcoin price is moving inside another bullish pattern, called the ‘Ascending Triangle,’ visible on the 3-day chart.
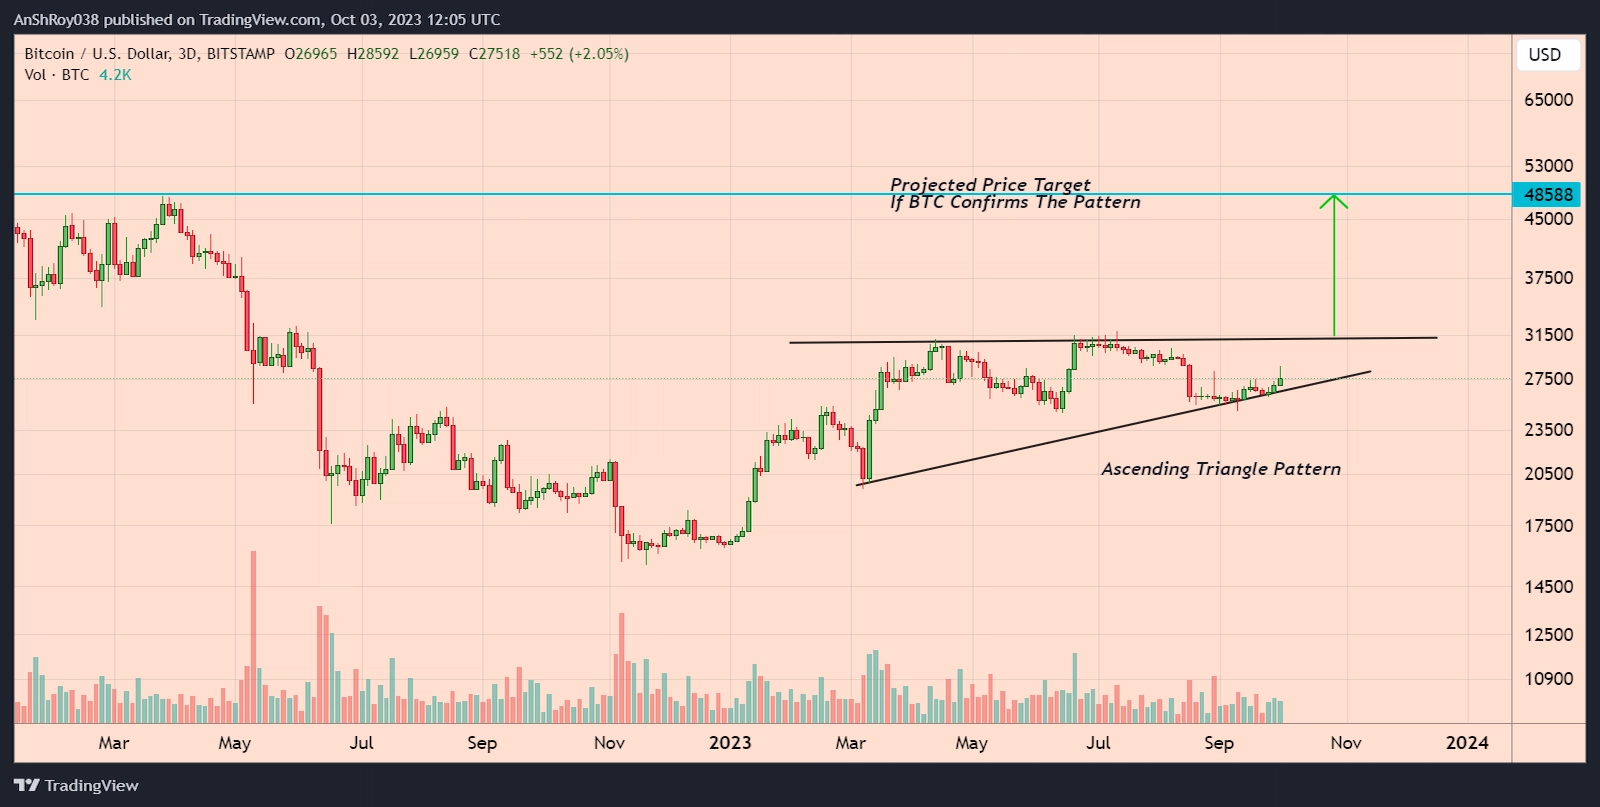
The technical pattern forms due to price moves that allow a horizontal trendline to connect the swing highs and a rising trendline to connect the swing lows. The price target for the pattern is equal to the triangle’s height at its widest part.
Thus, if the triangle pattern pans out, BTC price could rally 76% to reach the theoretical price target near $48,590.
On-chain Metrics For BTC Remain Bullish
Lastly, the on-chain metrics for Bitcoin suggest a bullish mindset among investors.
Per on-chain data provider Santiment, the total Bitcoin supply held on exchanges has dropped nearly 4.3% since Sept. 7 to reach 1.12 million BTC tokens on Oct. 3.
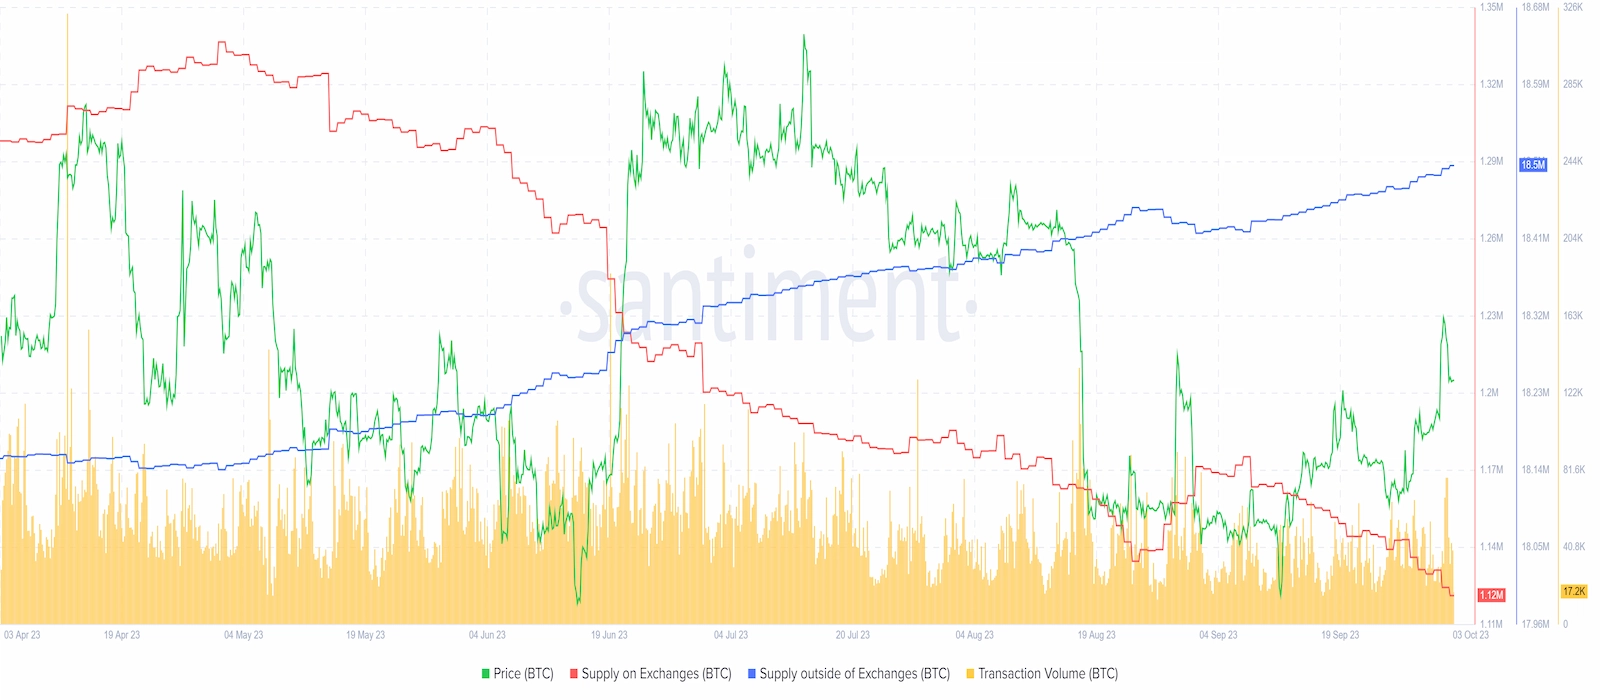
The supply held on exchange is an on-chain metric that highlights the selling sentiment amongst investors. A declining BTC supply on exchanges suggests traders are moving the crypto assets into cold wallets, which indicates a hodling sentiment among investors.
Investors generally hodl a token when they expect the asset’s price to rally. Furthermore, Bitcoin’s supply distribution also paints an interesting picture.
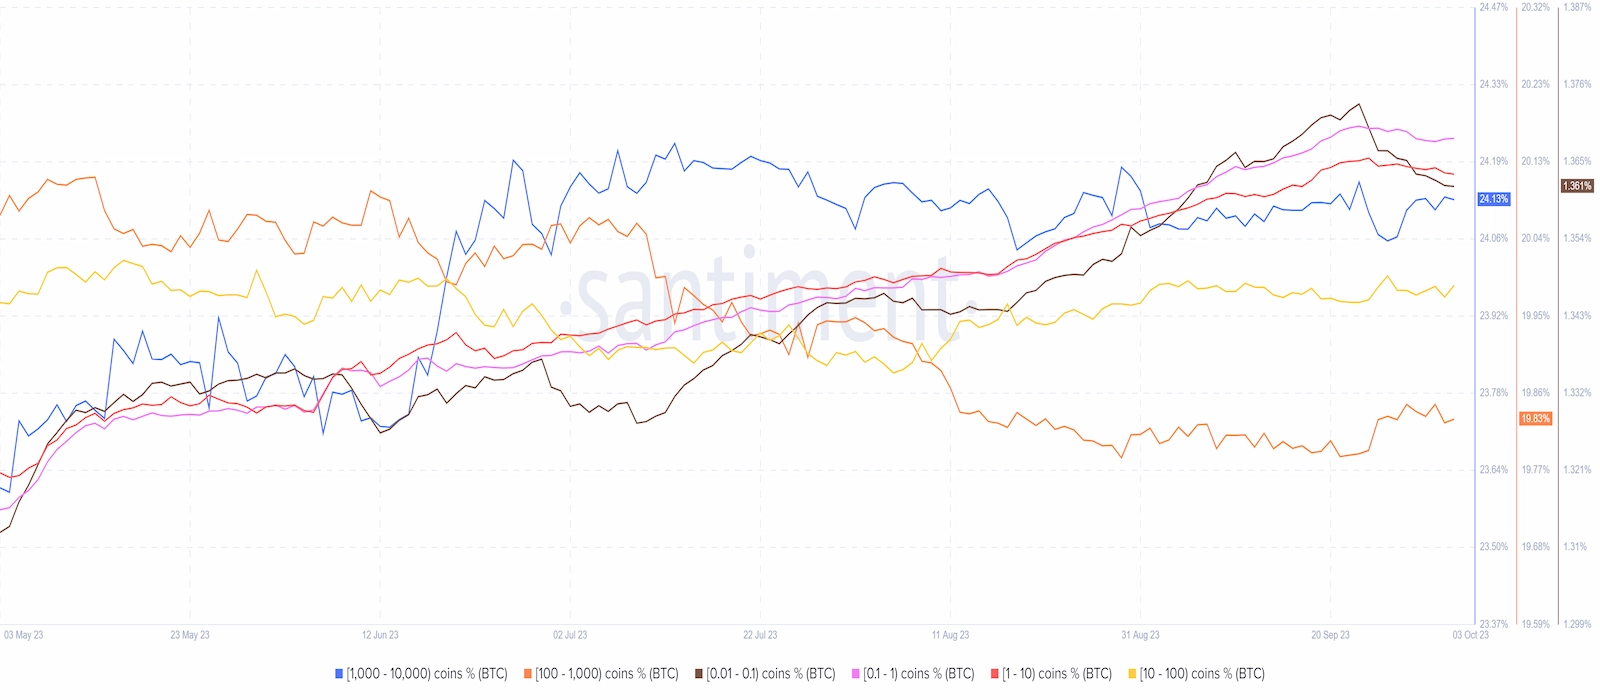
The number of addresses holding 0.1-1 BTC (pink wave), 1-10 BTC (red wave), and 1,000 to 10,000 BTC (blue wave) have risen recently, suggesting that retail traders and whales might have propped up the recent price rally.
Moreover, the count of shark wallets, with 10-1,000 BTC tokens, remained stable, whereas smaller wallets (0.01-0.1 BTC) saw a significant decline on Sept. 23 and continued to decrease. This indicates that individual investors may be hesitant to endure market volatility and are engaging in panic selling.
Moreover, Glassnode stated Bitcoins miner to exchange flow (7 days) reached a 1-month low on Oct. 3. The metric denotes the total amount of coins BTC miners deposit on an exchange. Low miner-to-exchange flow suggests miners are hodling their tokens in anticipation of a price rally.
The post 3 Wild Bitcoin Theories Pointing at Continuing BTC Price Rally in 2023 appeared first on CoinChapter.


