

Key Takeaways:
- Bitcoin price’s long-term outlook seems bright, per on-chain data problem.
- BTC price broke above $27,000 for the first time in a week.
- BTC price has formed a bullish technical pattern.
NEW DELHI (CoinChapter.com) — On-chain data provider Santiment has forecasted a “bright” long-term outlook for Bitcoin (BTC) prices.
The platform has based its speculation on the fact that whales are accumulating BTC and USDT. In a Sept. 27 post, Santiment noted that the US dollar had reached its highest levels since Nov. 2021, which is usually a bearish signal for crypto and other risk assets.
The on-chain data provider noted that Bitcoin price “held up well” during the US dollar index’s rally, which suggested that BTC price would likely break out once DXY settled down.

However, Santiment warned that BTC price might witness a correction in the short term since traders started booking profits after Bitcoin price reached $27,000 for the first time since Sept. 21. The profit booking suggested any relief rallies would face extreme selling pressure.
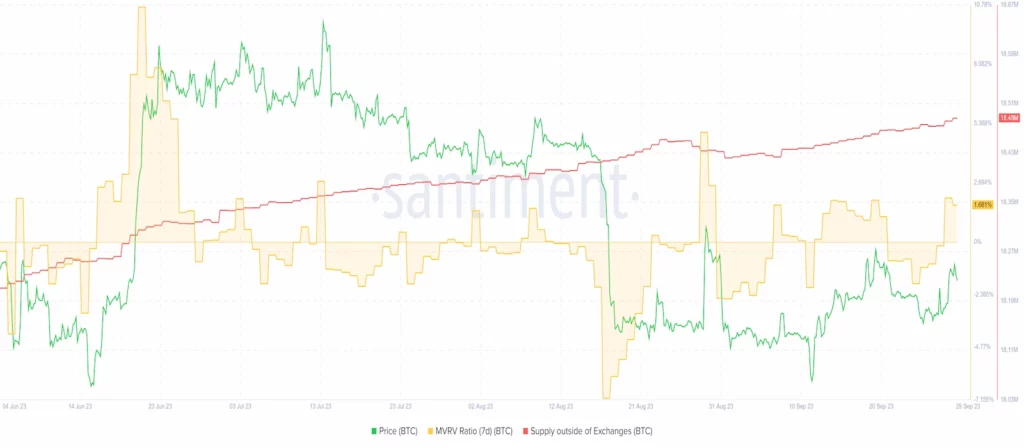
Santiment stated that once BTC’s MVRV ratio (yellow wave) reaches zero, the token might start a relief rally. The MVRV ratio is a metric that divides the market capitalization by the realized capitalization to determine an asset’s fair value.
Moreover, the number of non-exchange addresses holding Bitcoin tokens is rising, suggesting increased buying pressure and possibly a hodling mentality among investors.
Bitcoin Price Forms A Bullish Wedge
Meanwhile, Bitcoin price has formed a bullish technical pattern called the ‘Falling Wedge.’
The technical pattern forms when the price fluctuates inside a pair of falling trendlines that converge down the slope. The outcome of such downside patterns is typically a price breakout to the upside.
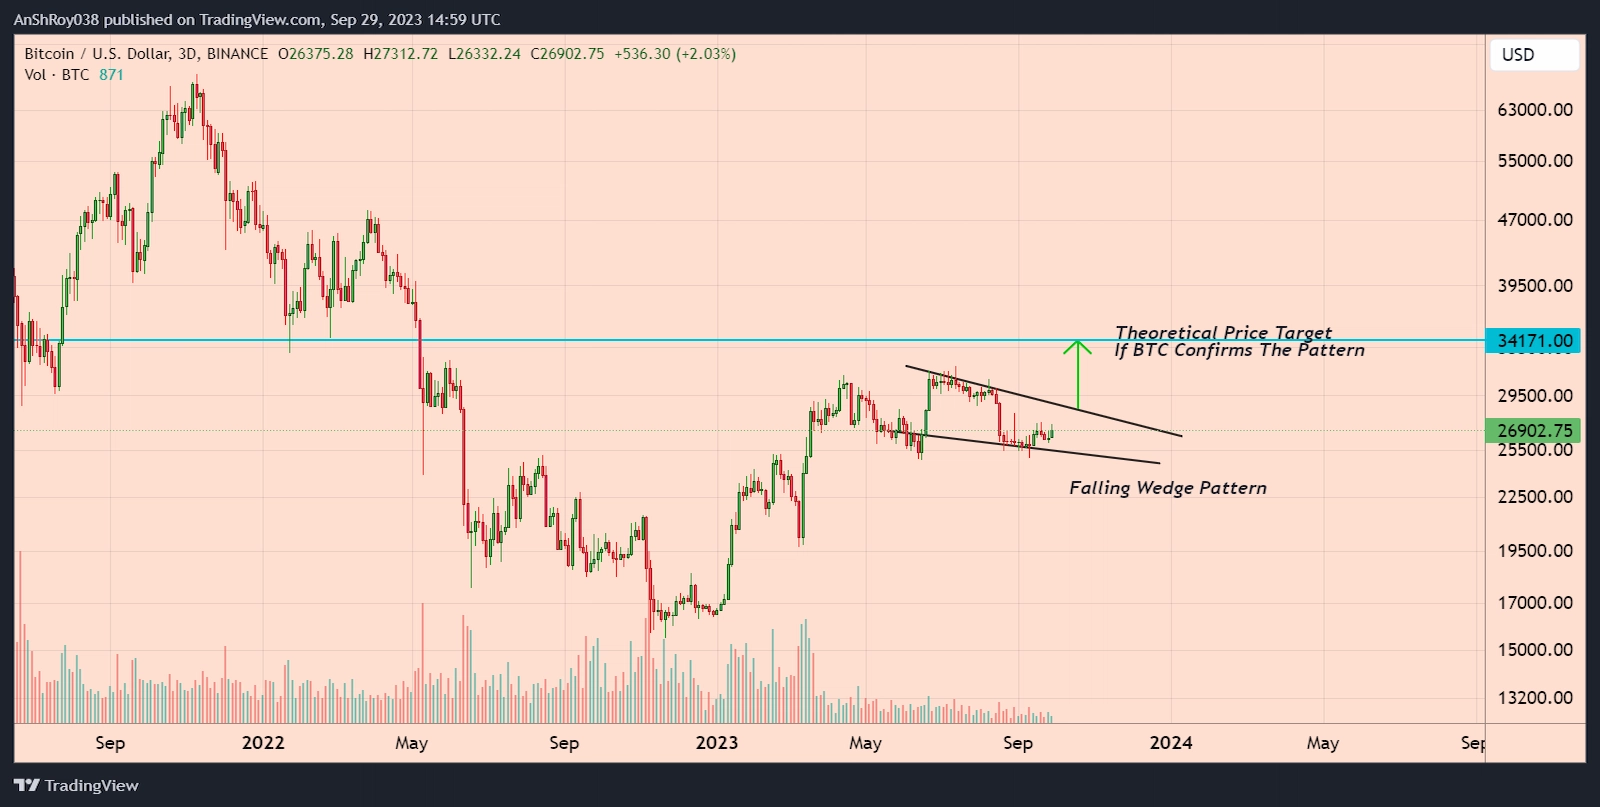
One key feature of the pattern is that volumes usually decline as the trendlines converge.
The upside target for the breakout is equal to the maximum distance between the falling wedge’s upper and lower trendlines. Thus, confirming the pattern could theoretically see BTC price rally 27% to reach the pattern’s calculated price target of $34,170.
BTC Price Rally Buckles Under Bearish Pressure
As Santiment noted, traders started booking profits after BTC price rallied nearly 4% to reach a 9-day high of $27,297 on Sept. 28. The resulting spike in the bearish pressure pared BTC’s gains on Sept. 29, forcing the token to drop 2% to a daily low near $26,682.
If the price correction continues, BTC might drop to the support near $26,080.
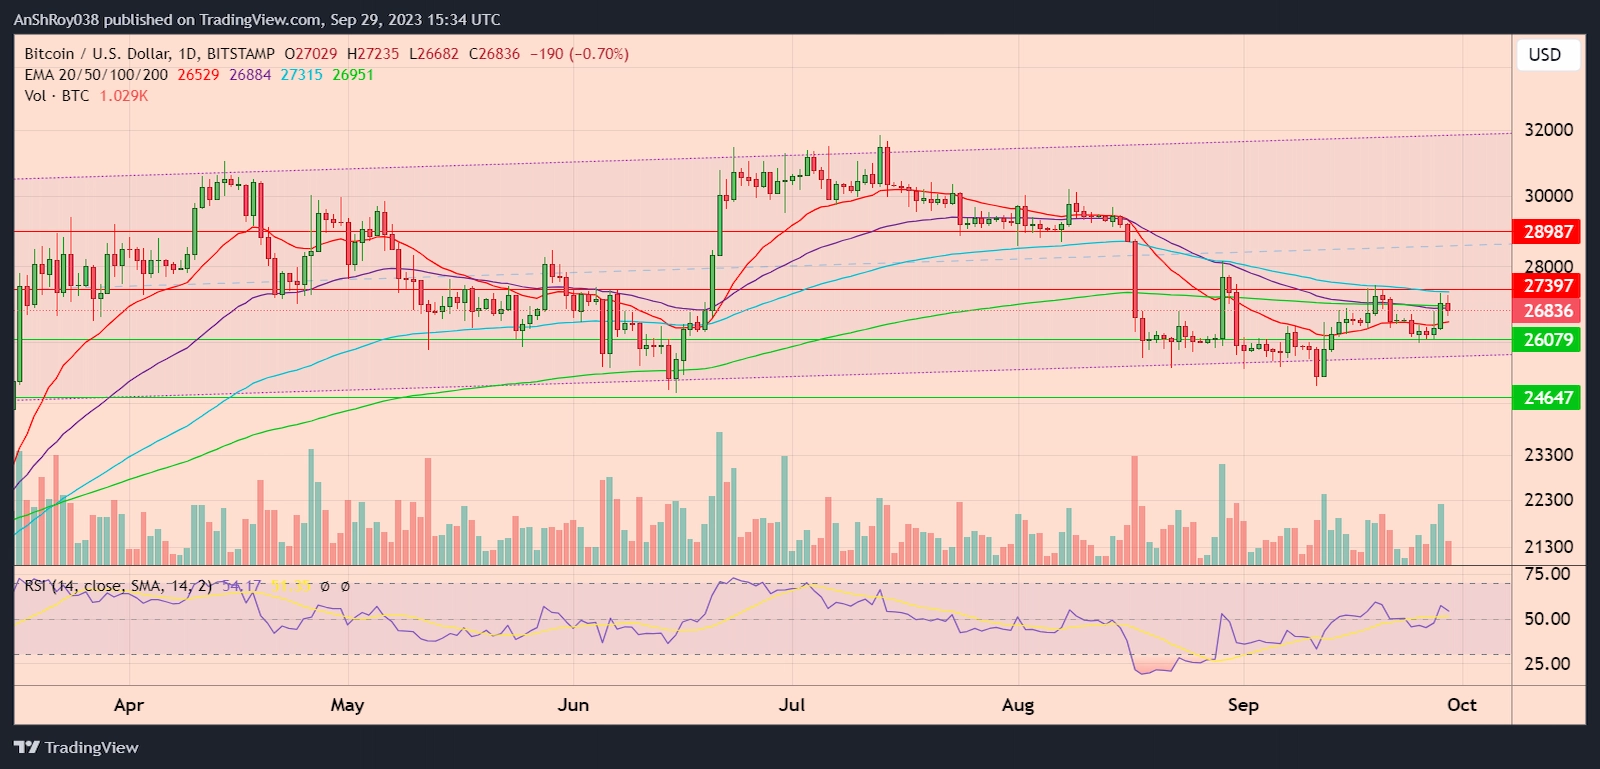
Moreover, breaching the immediate support level might see Bitcoin price drop outside the ascending channel it has been moving inside since March 2023, forcing BTC price to test the support level near $24,650.
Conversely, once BTC price starts rallying, the crypto would face the 100-day EMA (blue wave) resistance near $27,400. The 100-day EMA dynamic resistance has rejected BTC uptrends multiple times since Aug. 19 earlier this year.
Breaking over this key resistance would likely help BTC price target the resistance near $29,000 before correcting.
The RSI for BTC remained neutral, with a score of 54.17 on the daily charts.
The post Bitcoin and Tether Whales Enter Accumulation Mode — Big BTC Price Rally Coming? appeared first on CoinChapter.


