

YEREVAN (CoinChapter.com) – Bitcoin (BTC) price declined 2% on Sep 5, losing the $20,000 support and trading at just above $19,700. However, the decline could continue due to persisting miner selloff initiated in Q2, 2022.
Bitcoin miners sell
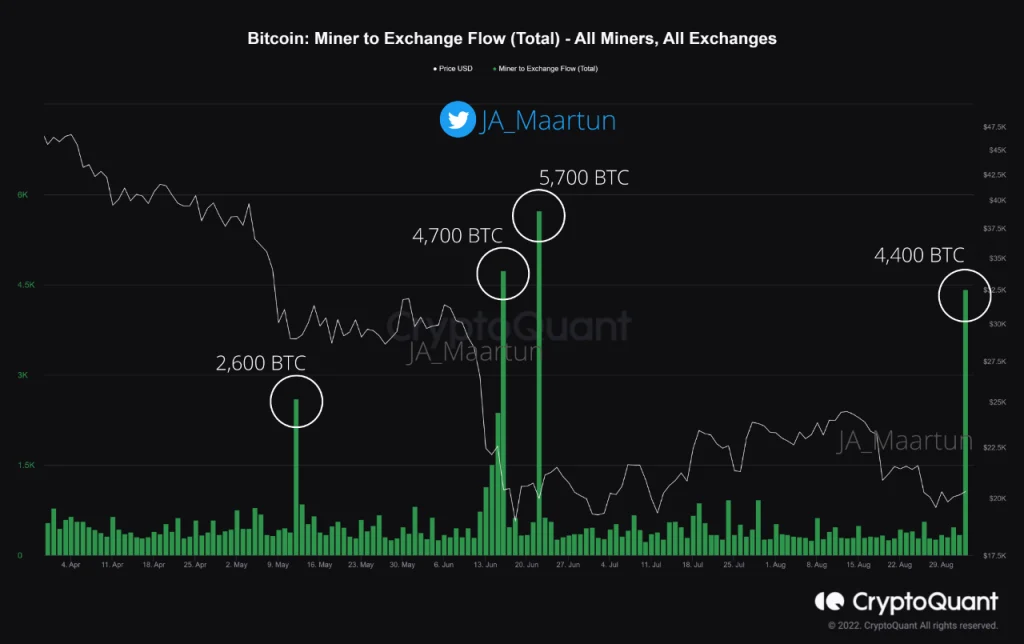
According to the latest data from the on-chain analysis platform CrytpoQuant, a miner disposed of 4,400 BTC on Sep 2, sending approximately $86.7 million to Binance. The transaction came from a BTC mining organization called Poolin and constituted miners’ fourth largest BTC sale since early July.
Previously, on May 12 12, miners moved 2,600 BTC, then another 4,700 coins on Jun 16. Additionally, on Jun 22, miners disposed of a whopping 5,700 Bitcoin. All the noted transactions are visible on the chart below.
The report also stated that long periods of realization below base cost “find resistance returning to profitability.”
This occurs because network participants seek to exit the market by zeroing their losses. This type of movement causes most currencies to be sold again at their average price during recovery periods within a bearish central trend (red arrow).
noted CryptoQuant.
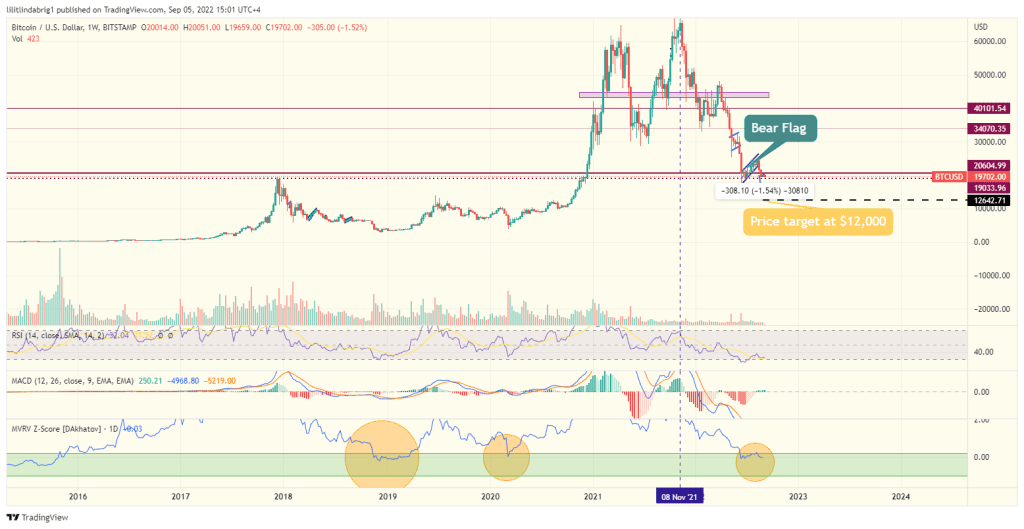
Additionally, the researchers commented that Bitcoin might be close to bottoming out according to the Market Value/Realized Value ratio, otherwise known as MVRV indicator.
MVRV points to the bottom for BTC
The metric compares Bitcoin’s current Market Value to its ‘fair’ value. The latter is calculated using standard deviation, which pulls out the extremes in the data between Market Value and Realized Value.
In detail, the Market Value (MV) reflects the current price of Bitcoin multiplied by the number of coins in circulation.
Realized Value (RV) does not consider the current BTC price. Instead, RV takes the price of each Bitcoin when it was last moved, i.e., the last time it was sent from one wallet to another. The indicator then adds up all those individual prices and calculates their average.
Also read: Nvidia stock drops under $140 per share while GPU prices slump.
The chart below indicates that the current MVRV ratio for BTC stood at just below 0 on Sep 5. Sep 5t non-conclusively, the ratio indicates that the bearish trend might reverse in Q4 2022.
Despite tailwinds from the MVRV, BTC price fell below the $20,000 support and threatened to lose more, based on a bearish setup, best visible on the four-hour chart.
BTC daily chart paints a Descending Triangle
The low time frame chart printed a setup dubbed ‘descending triangle.’ It occurs after sharp declines and features a flat support line and a descending resistance. The price action consecutively retests both before typically breaking below the support line.
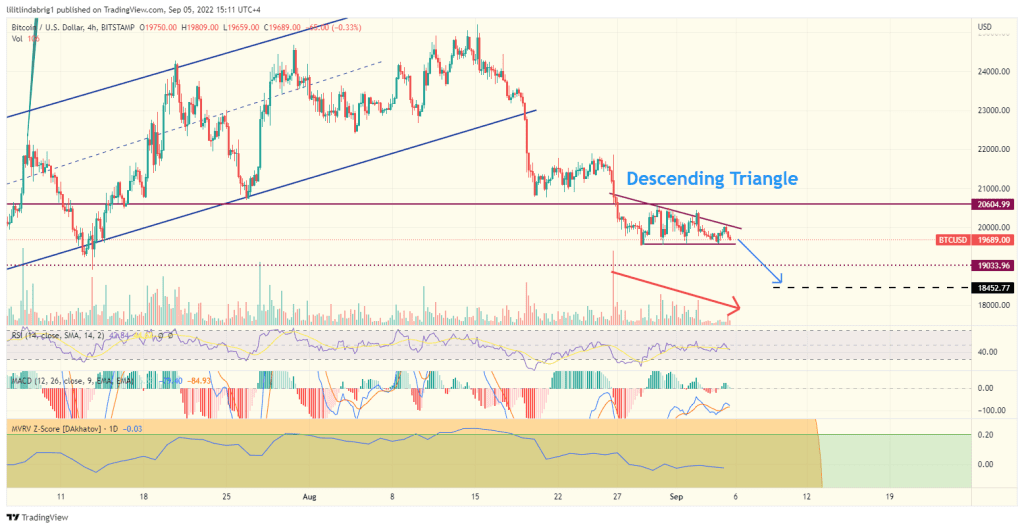
Additionally, the expected drop would equal the decline preceding the formation. Thus, the Descending Triangle pins Bitcoin’s short-term target price at roughly $18,500 in the upcoming sessions.
The post Bitcoin (BTC) falls below $20K amid miners’ capitulation appeared first on CoinChapter.


