

YEREVAN (CoinChapter.com) – Bitcoin price flatlined for over a week and was unable to get above the $20,000 support line with any confidence. However, the on-chain data indicates that both whales, addresses holding large amounts of tokens, and little fish, are on Bitcoin accumulation again, taking advantage of the depreciation.
Bitcoin Realized Cap at 74%
According to Ki Young Ju, the chief executive of crypto analytical platform CryptoQuant, the accumulation level has reached a 7-year high.
Over 6-month-old Bitcoins now take 74% of the realized cap. It was 70% and 77% at the last bottoms in 2019 and 2015, respectively.
commented the CEO.
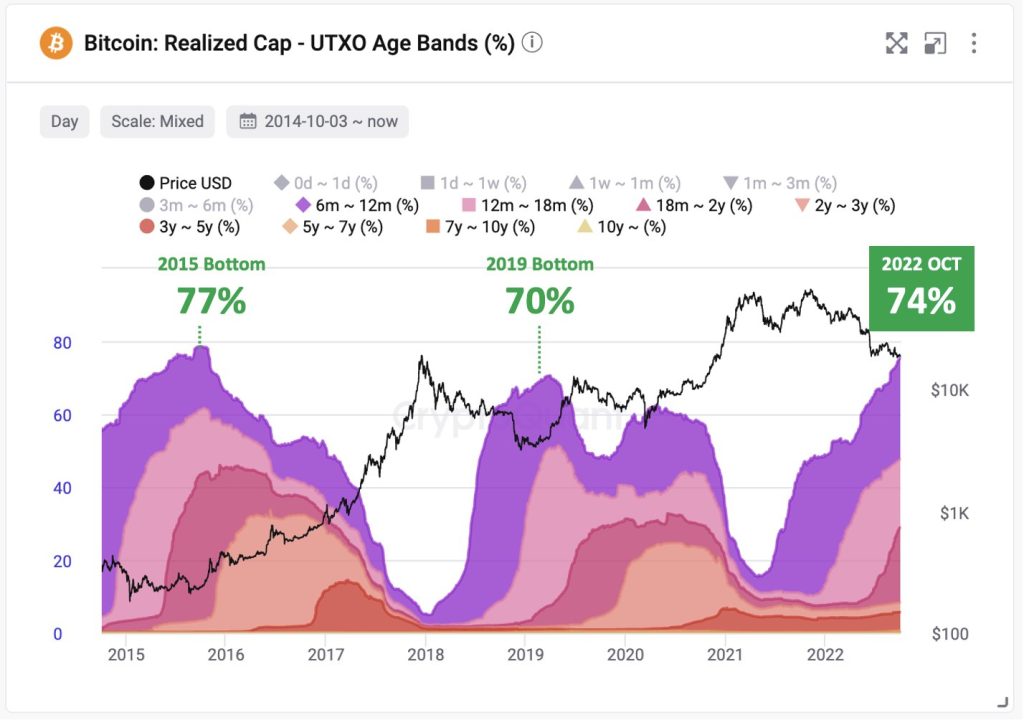
The analysis is based on the percentage of unspent transaction output (UTXO) age bands and the resulting Realized Cap. In detail, UTXO is the amount of digital currency remaining after a cryptocurrency transaction is executed.
Meanwhile, realized capitalizations track the valuation of an asset based on the price at which users moved it. As a result, the metric allows users to remove unnecessary granularities, especially lost or dormant coins, which helps them determine the asset’s market valuation based on actual units in circulation.
According to CryptoQuant, Bitcoin’s Realized Cap reached 74%. It means that over six-month-old unmoved Bitcoins take 74% of the market cap. In turn, the data signifies accumulation among BTC holders, which generally leads to price appreciation.
BTC Mayer Multiple at a 4-year low
Mayer Multiple (MM) is an indicator created to determine the best entry points into the market and the potential exit points. In other words, the MM is a gauge of when to buy and when to sell.
To calculate the Mayer Multiple, one has to divide Bitcoin’s current market price by its 200-day moving average (200-DMA), the mean of 200 days worth of prices. Thus, the closer the current price is to the 200-DMA, the closer the MM is to 1.
When the MM was higher than 2.4, the price action typically charts through ‘overbought’ territory and turns bearish afterwords, creating the perfect ‘sell’ spot. Conversely, whenever the MM is between 0 and 1, the price could bottom up and prepare to ascend for the long term.
As of early October, Bitcoin’s Mayer Multiple stood at -0.1, the lowest point since 2018. Thus, many market participants expect the flagship crypto to bottom-up soon.
Bearish factors for Bitcoin price
While the on-chain metrics point to a bias reversal, the macroeconomic turmoil wreaks havoc on crytpo prices. The total crypto market capitalization stood just above $918 billion on Oct 4, after a 63% drop year-over-year, albeit printing a weekly green candle.
However, the still-raging war in Ukraine, and the resulting tension rising between the West and Russia, China, and Taiwan, leave little hope for a market recovery any time soon. The instability makes investors extra cautious, and they avoid risk-on assets.
The post Bitcoin holders accumulate as BTC fails to hold $20K support appeared first on CoinChapter.


