

Key Takeaways:
- Bitcoin price holds crucial support near the 50-day simple moving average (blue).
- BTC/USD is trading inside a key contracting triangle with resistance near $29,400 on the daily chart.
- The price could rally again unless there is a close below $28,000.
YEREVAN (CoinChapter.com) — Bitcoin’s price trades in a positive zone above $28,000. BTC/USD might start a new rally if it clears the $29,000 and $29,550 resistance levels.
Bitcoin Price Remains In Uptrend
In the past few days, Bitcoin price saw a decent increase from the $27,000 support zone. The BTC/USD pair seems to hold magical support near the 50-day simple moving average (blue).
Recently, there was a steady move above the $28,000 and $28,500 resistance levels. The bulls were able to pump the price above the 50% Fib retracement level of the key drop from the $30,968 swing high to the $27,155 low.
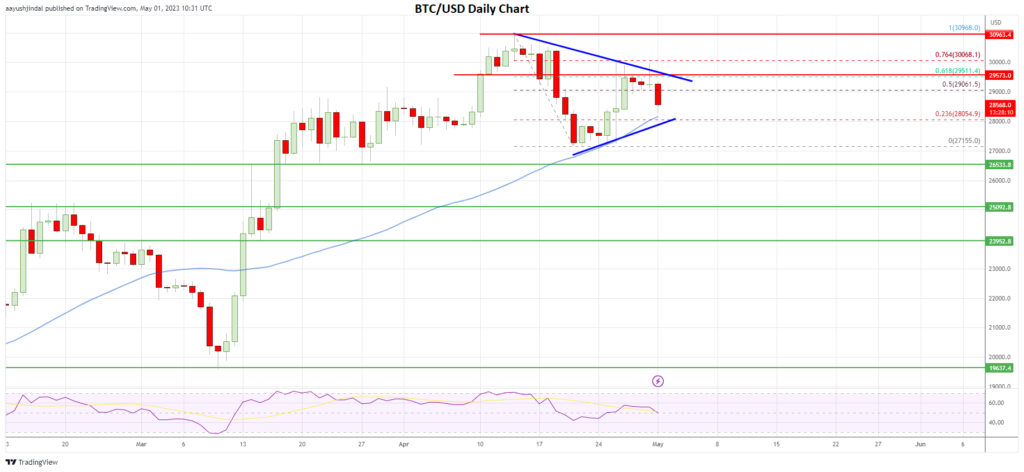
However, the price faced strong resistance near the $29,500 zone. It was rejected near the 61.8% Fib retracement level of the key drop from the $30,968 swing high to the $27,155 low.
There was a fresh decline below $29,000, but again, the 50-day simple moving average (blue) was strong support. The price is now consolidating and trading inside a key contracting triangle with resistance near $29,400 on the daily chart.
Immediate resistance is near the $29,000 level. The next key resistance is near the $29,500 zone and the triangle trend line. If there is a clear move above the $29,500 level, Bitcoin could rise toward the $30,500 resistance.
Any more gains might push the price toward the $31,000 resistance zone. In the stated case, a run toward the $32,500 level is possible.
Downside Break?
If not, the bears could make another attempt to push the price below the 50-day simple moving average (blue). If they succeed, Bitcoin might revisit the $27,155 swing low. The next major support is near the $26,500 level.
Any more losses could trigger an increase in selling pressure. The price may test the $25,000 support in the stated case. The next breakdown support is seen near the $23,950 level.
Overall, Bitcoin price holds crucial support near the 50-day simple moving average (blue). If BTC remains stable, there could be a fresh drift toward the $31,000 level. Conversely, the price may decline and revisit the $27,155 low.
The post Bitcoin Price Holds Magical Support at 50-day SMA, Time To Rally? appeared first on CoinChapter.


