

YEREVAN (CoinChapter.com) – Bitcoin bulls have doubled down after the devastating 2022 and started 2023 with an over 35% rally month-to-date. As a result, the BTC/USD exchange rate stood at $22,700 on Jan 23, well above the time-tested $20,000 resistance. However, the question remains, is the bull market cycle here, or will the price stall in 2023 before another leg up?
There are several cues to back both outcomes, so here is a recap of several on-chain indicators, technical cues, as well as macro factors that would help determine the alpha crypto’s upcoming trajectory.
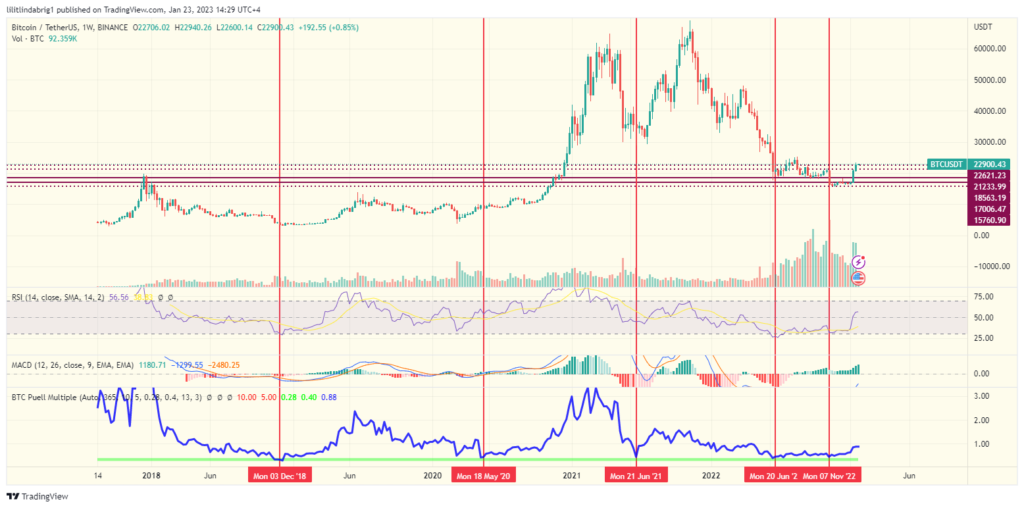
BTC Weekly Technicals Optimistic
Bitcoin’s weekly chart indicates that the alpha crypto conquered a confluence of resistance in January. Firstly, the digital asset broke a down-sloping trendline that hindered the upside attempts since Nov 2021. Also, BTC/USD traded above the flat $20,000 resistance on Jan 23 after retesting the said line as support on multiple occasions from Jan 15-20.
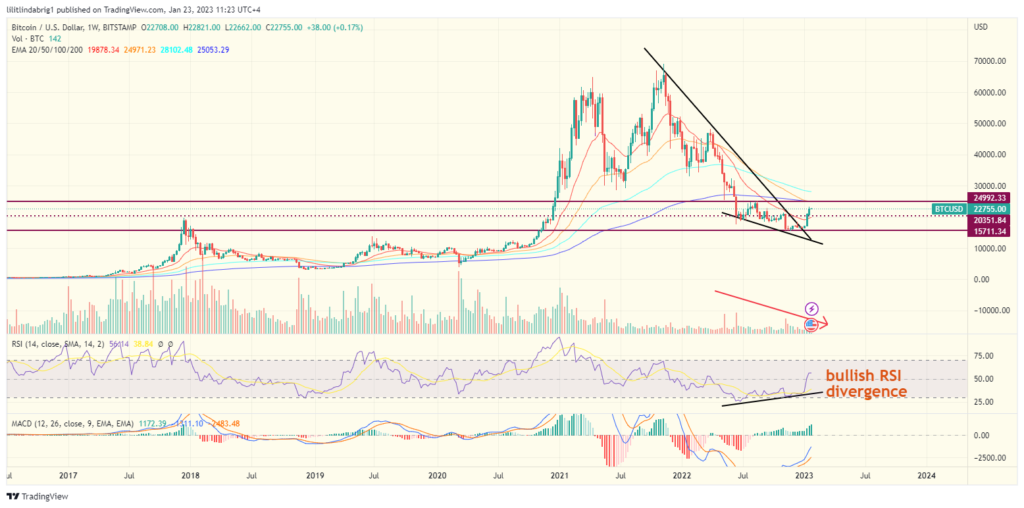
The relative strength index (RSI) tossed another bullish cue – a divergence between the price action’s lower lows and the RSI’s higher lows. Such a deviation is generally an indication of an upcoming price surge. Thus, weekly technicals pin a short-term target for BTC at the next resistance level of approximately $25,000.
Also read: Investors Cash Holdings at Record High – Good News for Stocks or Bonds?
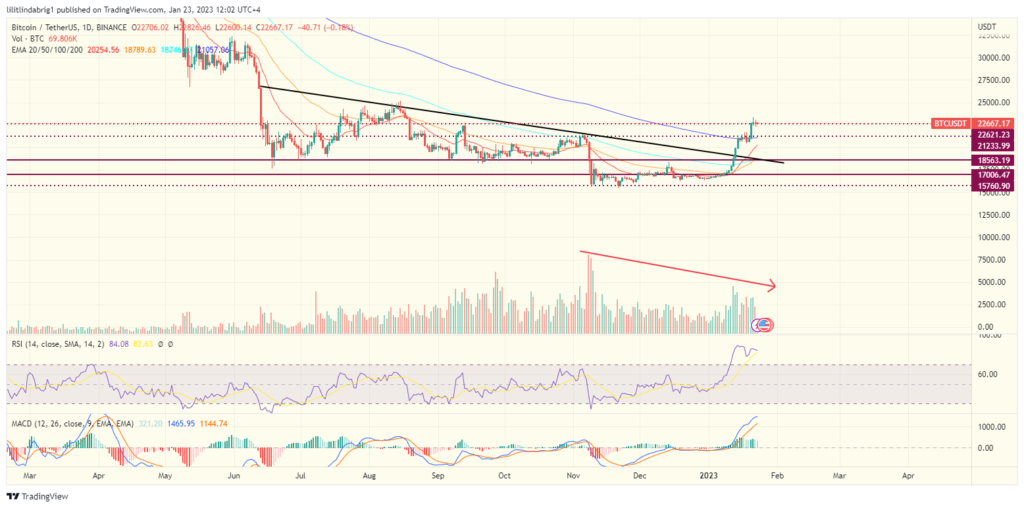
The daily chart foresees a short-term stall.
The daily chart showed a possible stall in the short term, while some traders pulled from the market to secure their recent gains. The lowering trading volumes backed the expectations, testifying to the still high FUD on the crypto market. Thus, the current $22,700 support (former resistance) is crucial in determining the upcoming bias.
But will other factors support the bullish claim or back the upcoming stall and possibly a reversal?
Bitcoin On-chain metrics conflicting.
Crypto analytical platform CryptoQuant analyzed BTC on-chain metrics on Jan 19, including several key indicators, such as Market value/Realized value (MVRV) ratio, Net Unrealized Profit/Loss (NUPL), and the Puell Multiple. The mentioned metrics were bullish, while the Network Value to Transaction (NVT) signal flashed warning signs. So, a closer look at each metric is warranted.
BTC MVRV has been bullish for months
In detail, MVRV is an indicator that tracks the ratio between Bitcoin’s market cap against the capital invested into the network. The price jumps and the MVRV spikes are correlated. Thus, many analysts use MVRV to identify the bull market tops and bottoms.
Typically, the market bottom is when the ratio hits 1.0 or drops lower, as seen in the chart below. Moreover, the MVRV has been below 1.0 since November 2022, giving off bullish hints.
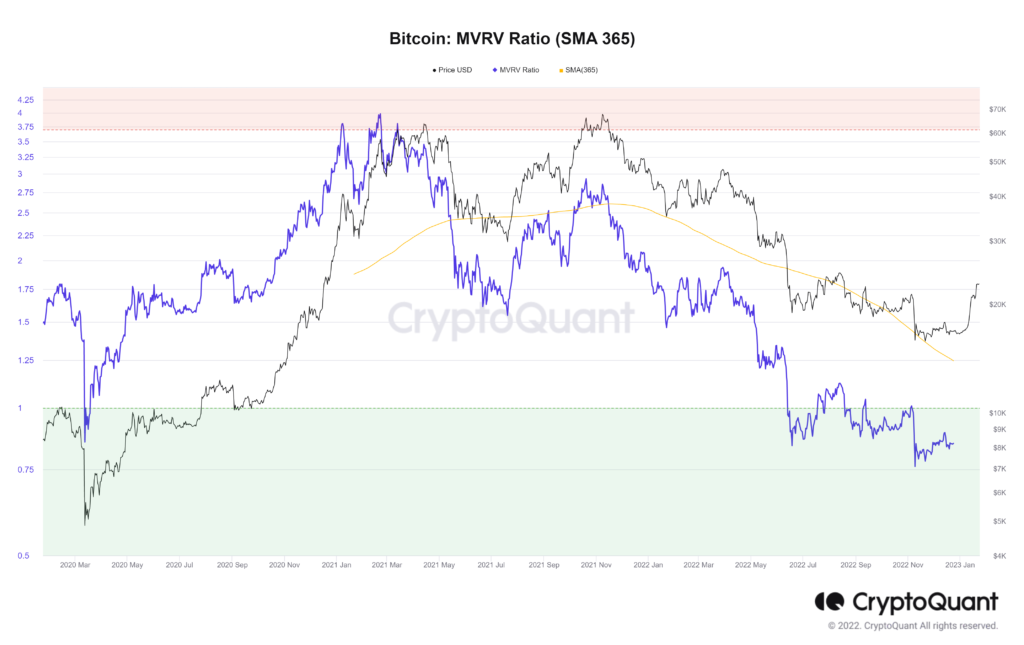
MVRV ratio is close to its 365-day moving average (orange line), showing that bitcoin is about to start a new uptrend.
noted CryptoQuant on Jan 19.
Puell Multiple dropped below 0.4
In short, the “Puell Multiple” indicator (PM) examines the fundamentals of miner behavior and how it can affect the market. PM is equal to the ratio of the daily coin issuance (in USD) to its 365-day moving average (in USD). If the PM is high, current miner profitability is high in comparison to the yearly average. Low values indicate the opposite.
Puell Multiple is showing a shift to a positive trend because bitcoin’s price has passed its 365-day moving average to the upside for the first time in a significant way since November 2020.
commented CryptoQuant, providing a chart to back the assumptions.
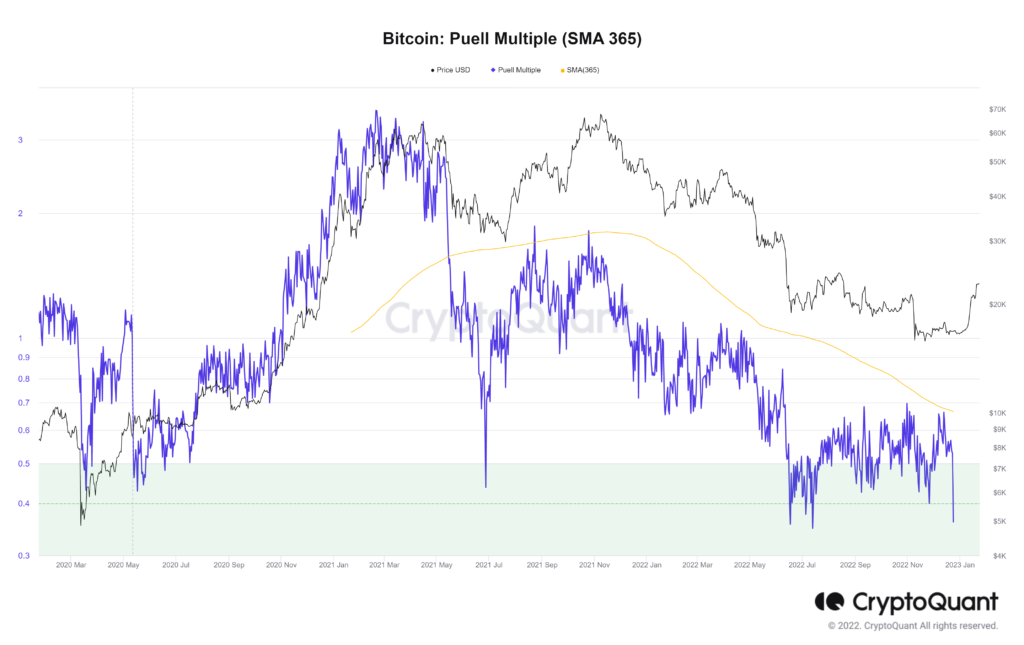
The weekly chart below demonstrates the PM effect on the price, confirming the bullish outlook. In detail, every time the PM indicator touched the green line below the blue graph, a bull cycle followed. Admittedly, the PM was below 0.5 several times throughout the previous year. However, the indicator has already picked up, which means another bullish phase might be in progress.
Also read: Bitcoin outperforms Gold in 2023 so far – bullish reversal, or dead cat bounce?
Bitcoin’s NVT signal might hinder the rally.
While the two indicators mentioned above make a strong bullish case, another analytical platform, Glassnode, noted a bearish indicator that could back the possibility of an incoming stall. According to the Jan 22 tweet, Bitcoin’s Network Value to Transaction (NVT) signal reached a 16-month high.
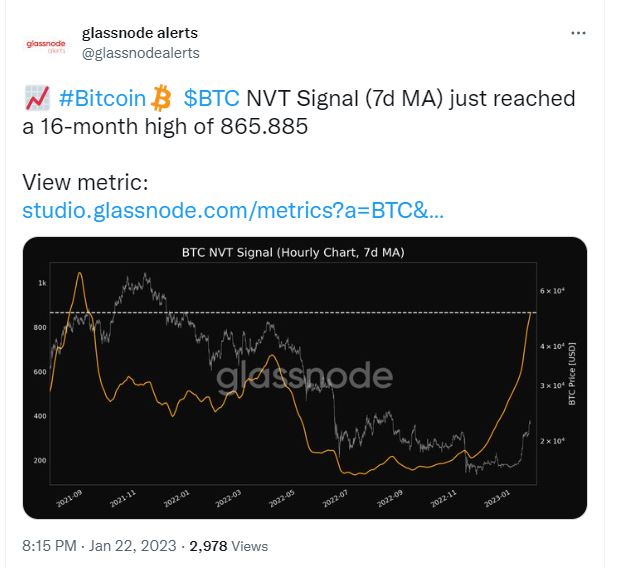
In short, the Network Value to Transactions ratio describes the relationship between market cap and transfer volume. Per analyst Willy Woo, its creator, NVT can be considered analogous to the PE (price to earnings) Ratio used in equity markets.
A growing NVT indicates that investors are pricing Bitcoin at a premium. Per Glassnode’s definition, NVT grows when “Market Cap growth outpaces utilization of on-chain transaction volume and value settlement.”
High NVT Ratio values have historically coincided with market tops and periods of overvaluation. Given the upward trajectory of the current NVT reading, a leg down or a stall might be in the books soon enough.
Some experts do NOT see a Bitcoin bull market cycle in 2023
Given the shaky geopolitical situation, the persistent inflation, and the Federal Reserve’s interest rate hikes extending to 2023, Bitcoin is expected to trade within a certain range and be sensitive to the macroeconomic situation.
Bill Tai, a venture capitalist, and crypto veteran, told CNBC in early January that he sees “a chance that [bitcoin] kind of has bottomed,” with no word on a possible bull run.
Meltem Demirors, chief strategy officer at CoinShares, did not have an overly bullish prognosis either. She said Bitcoin is likely to be rangebound, trading between $15,000 and $20,000 at the lower end and between $25,000 to $30,000 on the upper end. The expert also noted that there isn’t much money pouring into the digital asset sector at the moment.
Given the excessive amount of cash holdings at investors’ disposal, experts believe the bond market might see more attention, as opposed to the volatile stock market or other risk-on assets, such as cryptocurrencies.
Also read: Dec 2022 CPI report shows 6.5% core inflation – what to expect from Fed?
Conversely, Anthony Scaramucci, founder of SkyBridge Capital, called 2023 a “recovery year” for Bitcoin. Notably, he did not deny Demiror’s $15,000-30,000 estimation for 2023. But the expert predicted BTC/USD could trade at $50,000 to $100,000 in two to three years.
Conclusion
While Bitcoin’s double-digit rally inspired the bulls, it might not last long. Given hefty investments from the fiat economy in 2021, the alpha crypto now correlates with the equities and depends on the overall market climate. True, on-chain metrics overall show a bullish inclination ahead, which could be a viable long-haul strategy, given the growing adoption.
However, there might be more turbulence ahead in the coming year. Several experts mentioned above agree that while Russia’s invasion of Ukraine is in progress and the Federal Reserve implements hawkish policies to curb the runaway inflation, a true bullish cycle for Bitcoin might not be possible.
Click here to keep up with the ever-changing crypto market and never miss the scoop!
The post Bitcoin price over $22K – bull market cycle or dead cat bounce? appeared first on CoinChapter.


