

NEW DELHI (CoinChapter.com) – Bitcoin price declined heavily after rumors of Spot ETF rejections. However, BTC/USD remained well-bid above the 50-day SMA and might start a fresh increase.
Bitcoin Price Holds Key Uptrend Support
In the last Bitcoin price prediction, we discussed a steady uptrend above the 50-day simple moving average (blue). We also discussed the chances of another test of the 50-day SMA and the $40,000 support zone.
Recently, BTC saw a rejection pattern near the $46,000 resistance zone. There were rumors that the spot ETF could be rejected by the SEC in January 2024, citing a report by Matrixport analyst Markus Thielen. The price declined heavily below the $44,000 and $43,000 levels.
Later, the co-founder of Bitmain and Matrixport added that Markus also predicted that the spot ETF “might” be fulfilled with crucial requirements eventually in 2024 Q2 after the delay.
During all this, Bitcoin tumbled below the $42,000 support zone. However, the bulls were active near the 50-day simple moving average (blue) and $40,000.
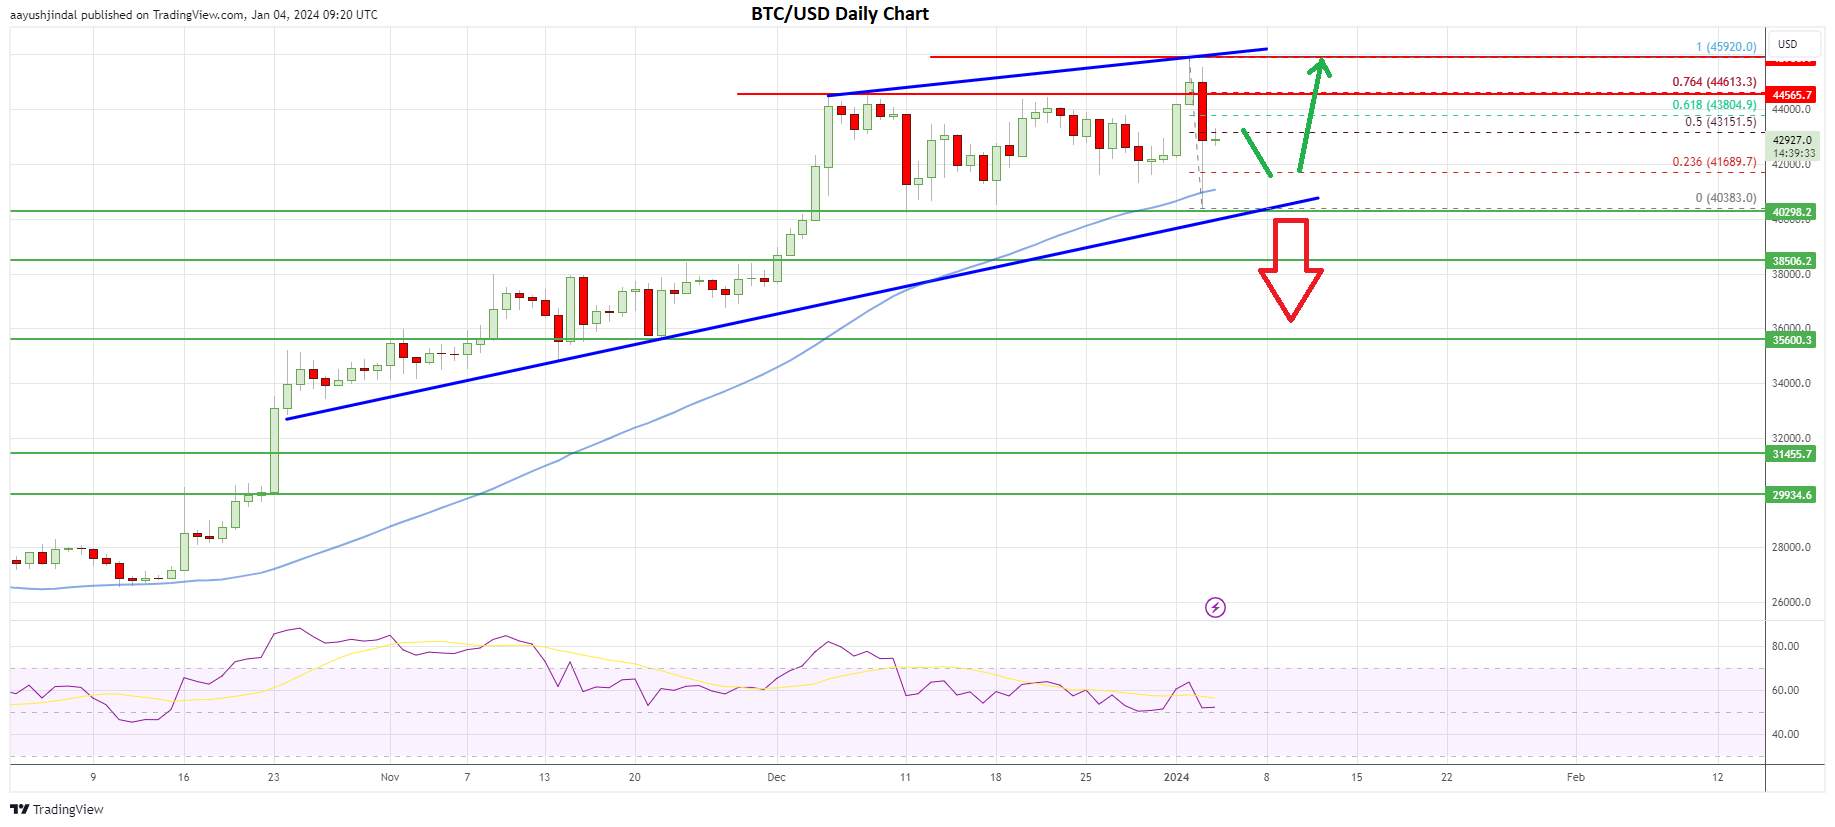
The price is also above a crucial bullish trend line with support at $40,350 on the daily chart. There was a strong buying interest near the trend line and $40,000. The price is now rising and trading above the $42,000 level.
On the upside, the first resistance sits near the $43,150 level. It is near the 50% Fib retracement level of the downward move from the $45,920 swing high to the $40,383 low.
The next key resistance for the bulls might be near the $46,600 zone or the 76.4% Fib retracement level of the downward move from the $45,920 swing high to the $40,383 low. A convincing move above the $44,600 resistance could send BTC toward the $46,000 resistance zone. A close above $46,000 could open the doors for a move toward the $48,000 level.
Another Bearish Wave in BTC?
Conversely, Bitcoin price might see another drop below the $42,000 support. The main support seems to be forming near the 50-day simple moving average (blue) and the trend line.
A daily close below the trend line and then $40,000 could spark heavy bearish moves. The next key support is near the $38,500 level. Any more losses might send the price toward the $35,600 level.
Overall, Bitcoin price is still holding the key uptrend support at $40,000. If BTC stays above $40,000, there could be a fresh increase toward $44,600 and then $46,000. Conversely, the bears could aim a move toward $35,600.
The post Bitcoin Price Prediction January 2024 – Is This The Drop Bulls Were Looking For? appeared first on CoinChapter.


