

Key Takeaways:
- Bitcoin faces the prospects of another boring week.
- The price will likely trade above $25,000 ahead of the ISM Services PMI data.
- A ‘bear flag’ projects the BTC price at $23,500 in September.
YEREVAN (CoinChapter.com) — Last week, the pump-and-dump led by the Bitcoin ETF buzz showed a greater bias conflict between bears and bulls. The sideways consolidation trend could continue in the week ending Sep. 10 due to a lack of market-moving catalysts.
Wait-and-Watch Approach Ahead of ISM Data
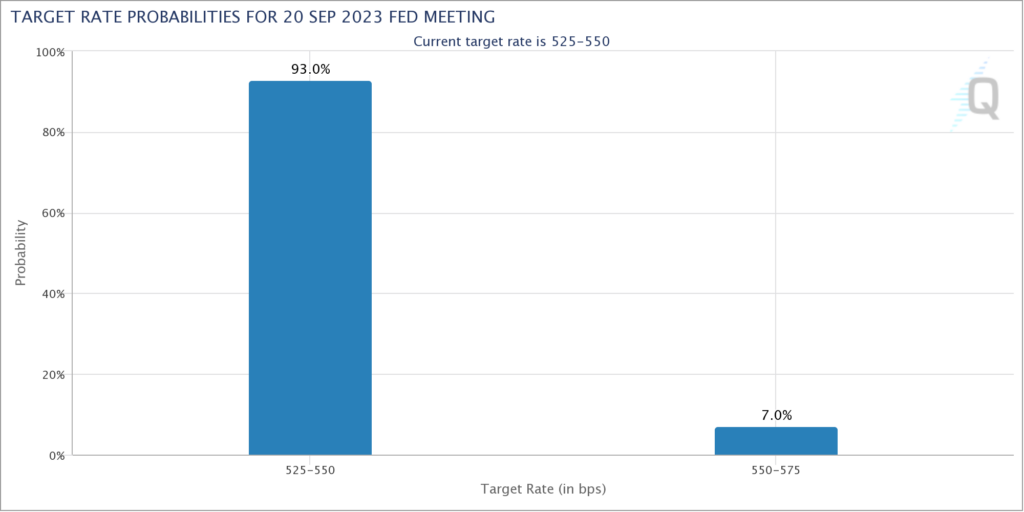
Bitcoin’s whipsaw price action is down to the fact that the US jobs data cooled down last week, raising anticipations that the Federal Reserve will pause interest rate hikes in their next meeting on Sep. 19-20. For instance, the CME Fed Funds Futures pricing increased the rate pause probability in September to 93%, up from 80% last week.
Nonetheless, Fed Chairman Jerome Powell displayed hawkish during his Jackson Pole address two weeks ago. That has created a conflicting scenario across the riskier assets, with Bitcoin particularly trending cautiously inside the $25,300-28,000 range for the last two weeks.
The ISM Services PMI data for August will be released on Sep. 6. The market expects the data to show that the US business activity has slowed down compared to July but remains technically expanding with a reading above 50.
That is — again — a mixed signal for the Fed that wobbles between rate hike and rate pause decisions. As a result, Bitcoin could remain flat for the remainder of this week.
Bitcoin Price Technical Analysis and Final Thoughts
From a technical standpoint, the Bitcoin price’s immediate downside target is $25,000, a long-serving support level. However, the BTC price could fall further in September due to its prevailing bear flag pattern, with a target near $23,500, down about 10% from current levels.
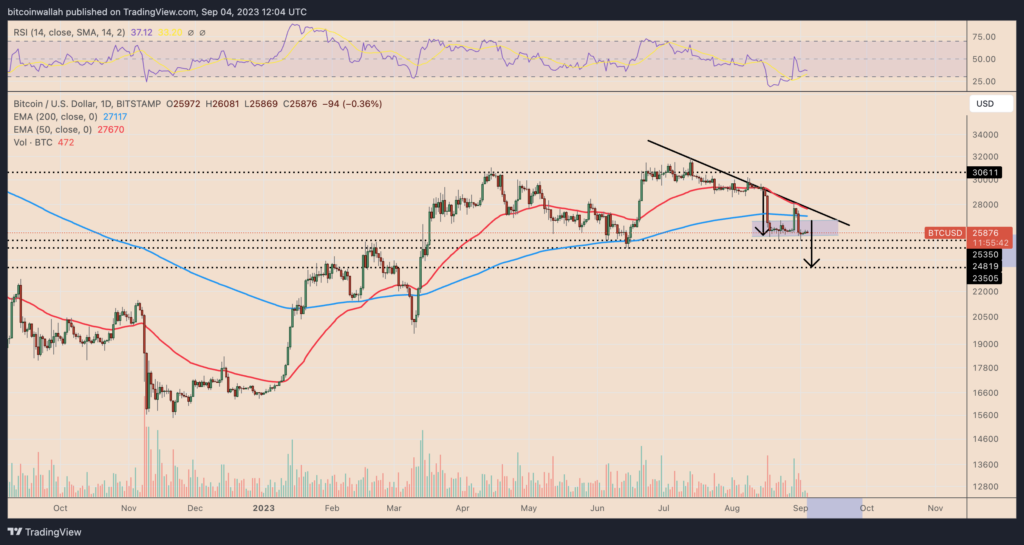
Conversely, a bounce from the flag’s support could result in a short-term rally toward the flag’s resistance, near $26,880. This level, up around 6% from current prices, coincides with Bitcoin’s 200-day exponential moving average (200-day EMA; the blue wave).
The post Bitcoin Week Ahead Ep28: ISM Data to Provide Further Bitcoin Price Guidance appeared first on CoinChapter.


