

The price of BTC needs to stay above $ 45,000 to stop the fall that is expected to extend towards$42,800.
The price of Bitcoin has continued to struggle as the bears extend Tuesday’s massive rout towards the $45,000 zone.
The pullback, which occurred on the day Salvadoran Bitcoin adoption law took effect, saw the price of BTC jump from a high of $ 52,944 to a low of $ 42,830 before the bulls rallied to record a daily close above $46,894.
Nevertheless, Bitcoin had its biggest one-day fall on the daily chart since May 12, with BTC/USD down more than 11% on the day and buyers suffering a $5,000 rout.
At the time of writing, Bitcoin’s price is close to the $ 45,385 mark while selling pressure remains. Any further losses could lead to a return to yesterday’s lows.
Bitcoin price vulnerable to further losses
Bitcoin’s price hit highs near $53,000 on Tuesday morning, breaking through a key resistance area around the $ 52,500 area. The market failed to break through the daily high, however, and the resulting sell-off quickly pushed the BTC/USD pair under the key support of $ 50,000 and $48,000.
On the daily chart, the price of BTC broke below the lower curve of the Bollinger bands indicator, with the price retesting a critical horizontal support line (red line).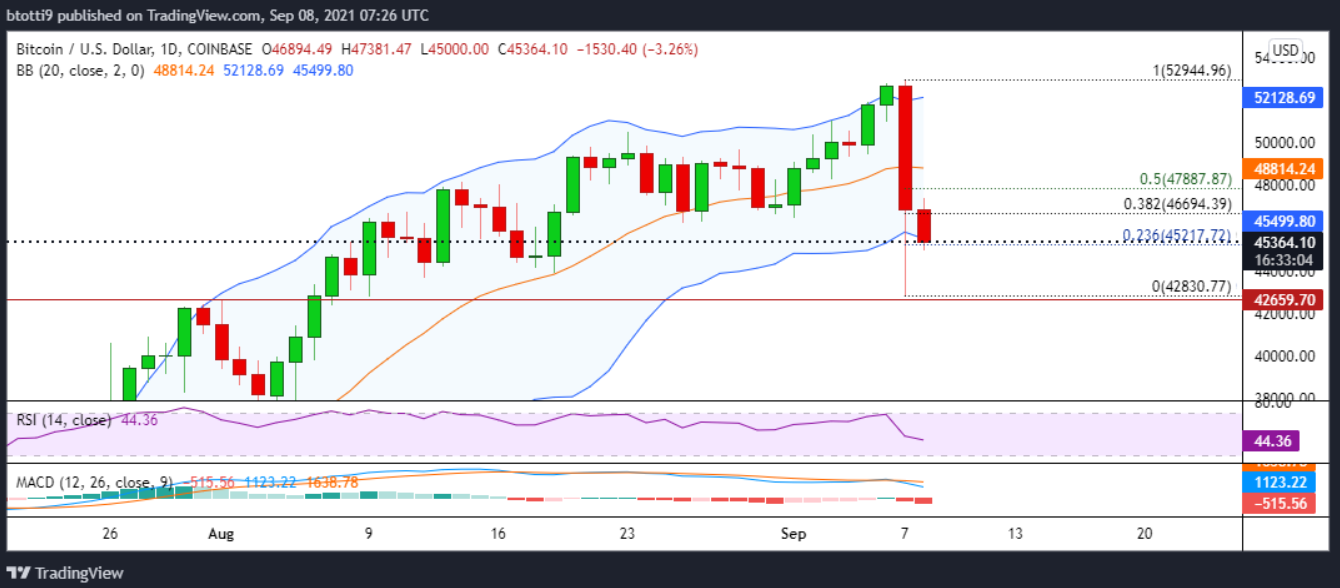
daily chart of BTC/USD. Source : TradingView
Attempts by the bulls to regain control have so far failed as the price struggles to hold above the lower band of the Bollinger bands. The drop in the RSI below 50 and the bearish crossover of the daily MACD suggest that the bears have the upper hand, a signal that the price of Bitcoin could suffer further losses.
Currently, Fibonacci’s 23.6% retracement level of the decline from $ 52,944 to $ 42,830 provides support at $45,218. If the price breaks below this level, the next stop could be around $44,500. Below this anchor, the downside target for bearers will be the September 7 low, near $ 42,800.
On the upside, the bulls have a difficult task ahead to turn the resistance area at the Fibonacci retracement level at 38.2 % ($46,694) into support. Exceeding this level would allow buyers to target the Fib level of 50 % ($47,888).
The next resistance area is at the median Bollinger bands curve currently at $ 48,814, with the next supply wall likely at the psychological level of $50,000.
From there, BTC/USD could resume its upward trend and aim for new highs above $52,000.


