

ETH / USD remains on track for a new all-time high, but a move below $ 3,800 could trigger a reversal to the $3,500 zone.
ETH’s price hovers around $ 3,856 at the time of writing, with the bulls experiencing the second day of bearish pressure that capped its latest rise. The downward pressure threatens to push the ETH / USD pair lower, which could see the bearers establish the $ 4,000 area as the main supply wall.
Notably, Ethereum’s price peaked at $ 4,030 on cryptocurrency exchange Coinbase on September 3 and reached a daily close of $ 3,940 – the highest close since May 14. As Bitcoin (BTC) looks to strengthen above $ 52,000, a similar move for ETH could put in play a rise to the all-time high.
According to the famous technical analyst Rekt Capital, the bullish point of view for ETH is supported by the possibility of a “U” – shaped formation.
$ETH is in the process of retesting the top of its multi-month U-Shaped formation
Successful retest will validate the formation to bring upon a new macro uptrend into new All Time Highs# Crypto # Ethereum
– Rekt Capital (@rektcapital) September 6, 2021
Ethereum price outlook
Ethereum’s break at the $ 4,000 level followed a bullish flag formation on the daily chart. Breaking above the resistance line around $ 3,330 saw the bulls reach the high of $4,030.
Although profit-taking has seen prices fluctuate below $ 3,900, the technical picture suggests that upside still has the upper hand. We have the daily RSI with positive divergence and close to overbought territory, while the daily MACD is in the bullish zone.
If ETH / USD holds above $ 3,832 (yellow horizontal line), a quick rebound could include a break above the $ 3,950 to $4,078 price range. Offers above the $ 4,080 supply wall could allow buyers to push ETH / USD towards the $4,400 level.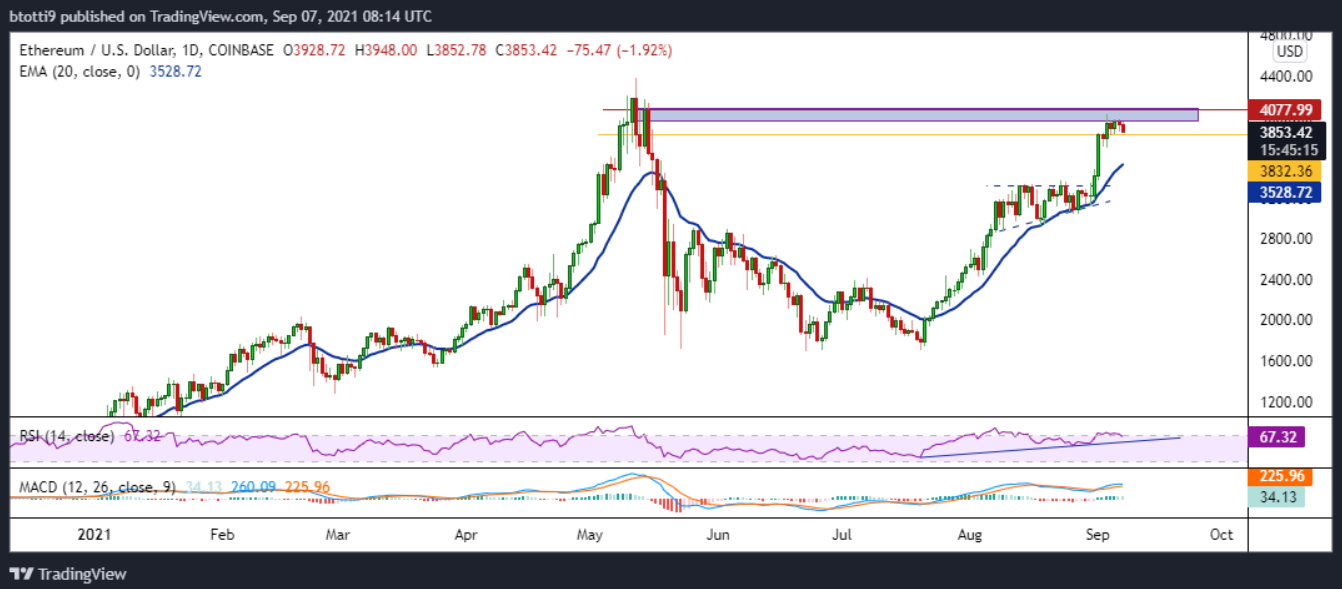
Daily chart of ETH / USD. Source : TradingView
On the downside, a break below the $ 3,832 line could call for more sales. In this case, the price of Ethereum could drop as far as the 20 EMA line currently located at $3,529. In the event of a prolonged short-term decline, the bulls may look to defend the gains at the horizontal anchor level near $3,330.


