

PATNA (CoinChapter.com) — About a year after the launch of the world’s first exchange-traded fund tracking the price of bitcoin, ProShares’ Bitcoin Strategy Fund (BITO) has underperformed BTC prices by 1.79%, per data from Arcane Research.
The fund amassed over $1 billion in its first week of trading on the New York Stock Exchange. Since then, BITO has bled more than Bitcoin (BTC), which has fallen nearly 70% since BITO’s launch date of Oct 18, 2021.
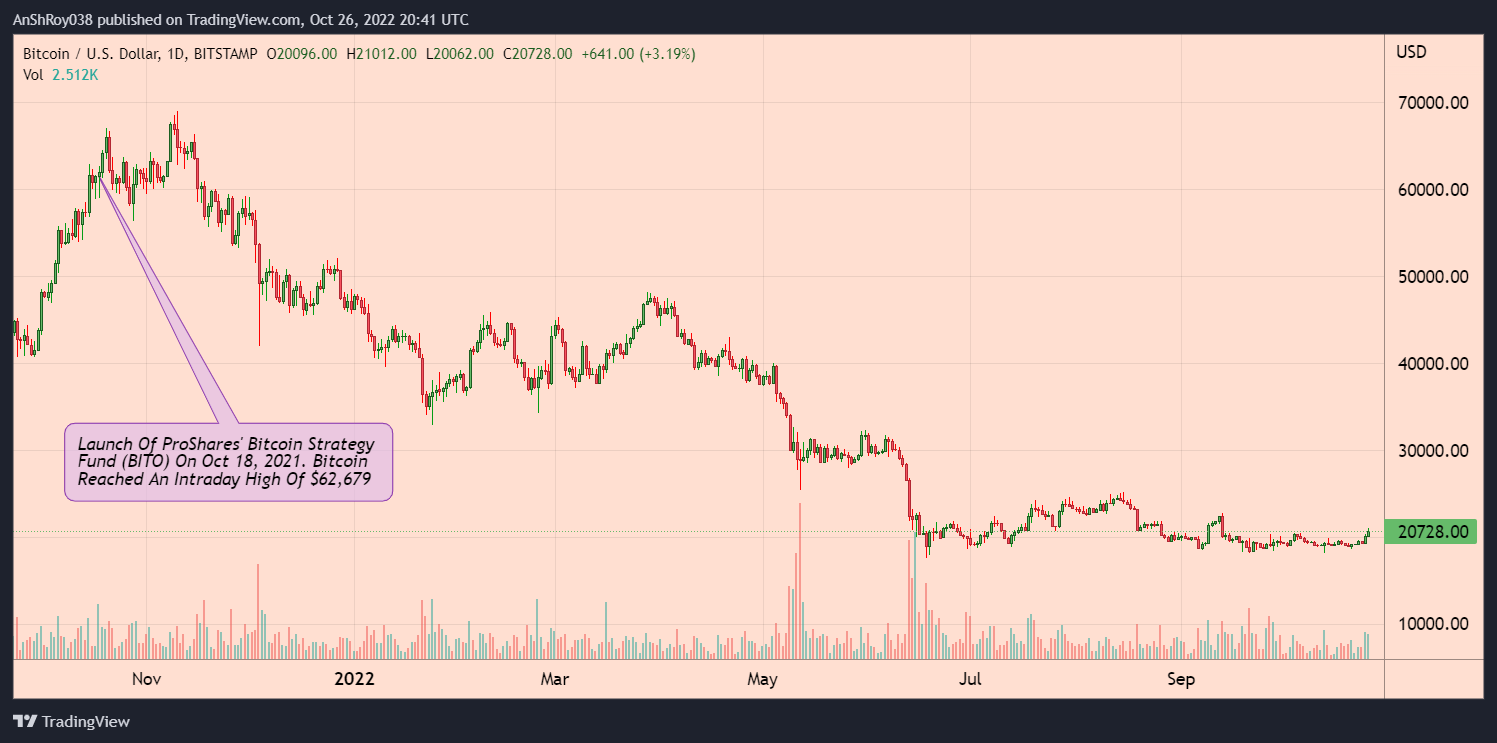
Furthermore, the 70% drop in BITO share prices also makes the Proshares’ Bitcoin ETF the sixth worst-performing debut ETF of its kind of all time.
Also Read: Twitter Loses Active Users, But TWTR Stock Rebounds – What Next?
Meanwhile, post-launch of the Proshares’ ETF, Bitcoin’s prices have mimicked the crypto token’s reaction to Chicago Mercantile Exchange (CME) introducing Bitcoin futures trading on Dec 17, 2017. On the same date, BTC price reached an intraday high of $19,666.
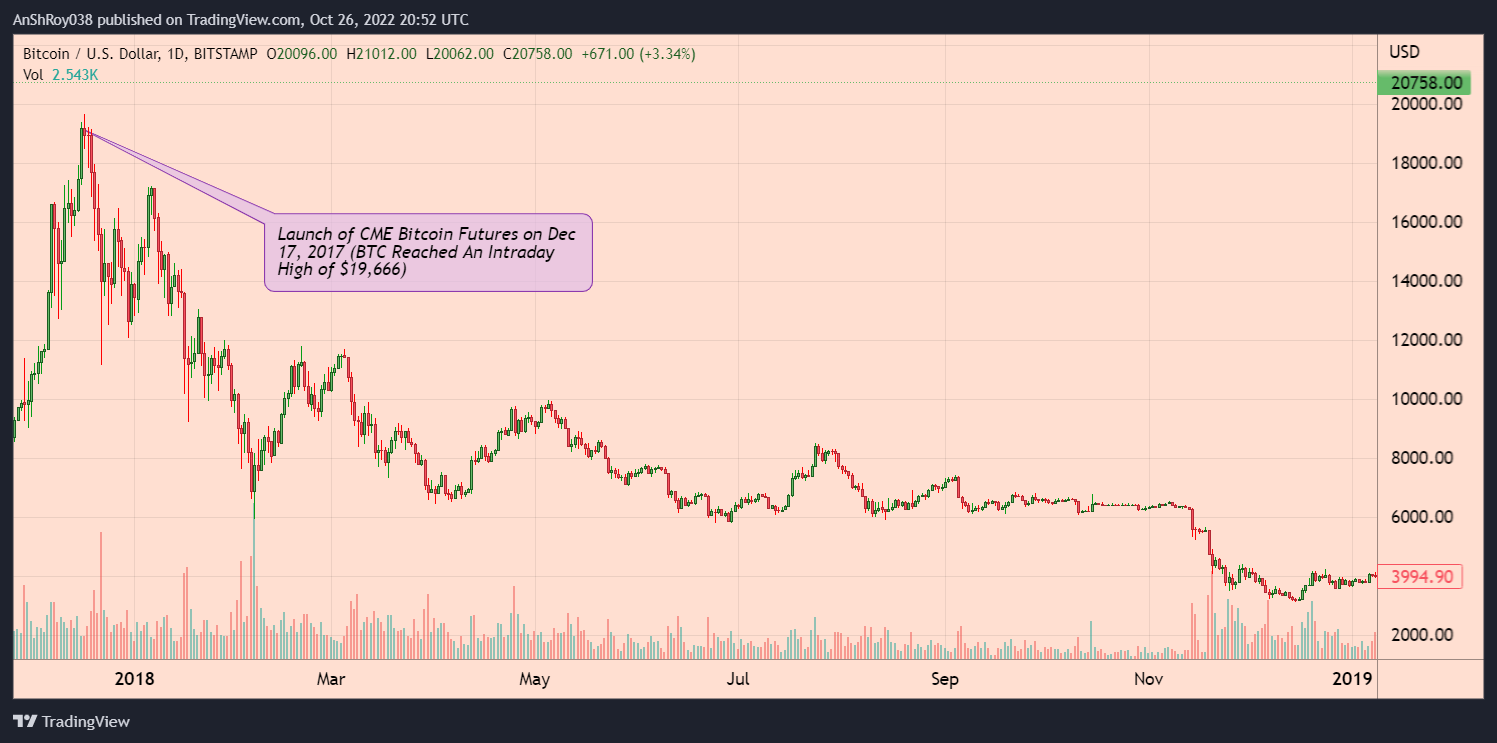
BTC price fell nearly 84% from the launch date’s intraday high of $19,666 to an intraday low of $3,181 on Dec 18, 2018. Bitcoin’s recent decline is almost reminiscent of its 2017 fall. A 2017 San Francisco Federal Reserve research paper stated that the fall was directly tied to the futures market launch.
The rapid run-up and subsequent fall in the price after the introduction of futures does not appear to be a coincidence.
The Fed researchers wrote
The researchers compared BTC’s price reaction in 2017 to mortgage-backed securities, which they said had a similar driving force. The report noted that until BTC futures existed, it was nearly impossible to bet on the decline of Bitcoin prices.
Bitcoin Price Breaks Above $21,000
On Oct 26, Bitcoin price broke above $21,000 for the first time since Sept 13, after BTC jumped nearly 5% to reach an intraday high of $21,012 from the day’s low of $20,062. The move comes on the back of BTC registering a 3.42% gain on Tuesday.
However, the price gain helped the crypto token break above multi-month trendline resistance.
Also Read: Shocking! Bitcoin Hashrate Hits Record High Despite Skyrocketing Energy Costs and Depressive BTC Price
Suppose the OG crypto consolidates above the trendline resistance. In that case, it will help increase investor confidence in Bitcoin and help the token cross above immediate resistance from its 100-day EMA (blue wave) near $21,200.
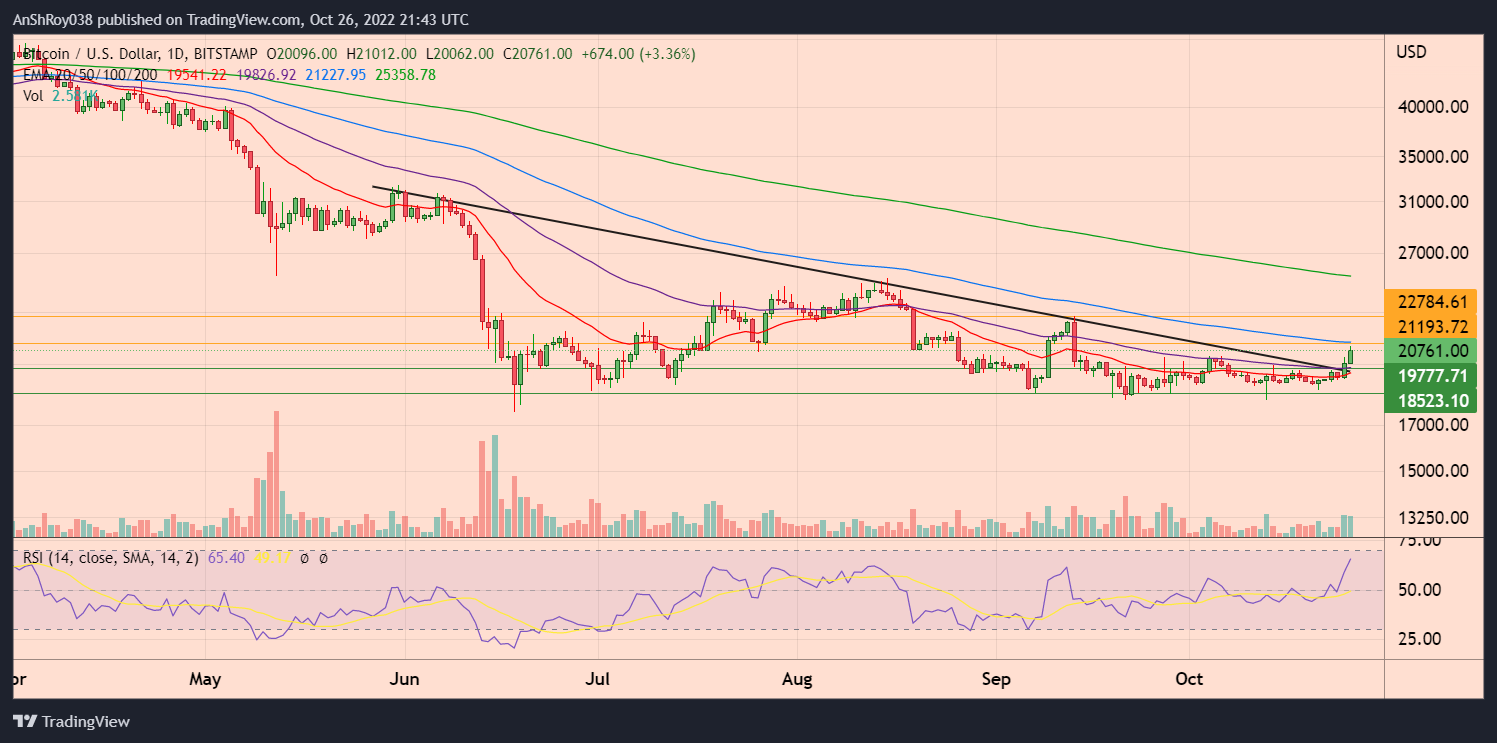
Moving above $21,000 would help Bitcoin price challenge resistance near $22,800 before retreating.
Meanwhile, the uptrend resulted in BTC’s relative strength index moving close to the overbought threshold, with a value of 65.4 on the daily charts. Traders usually consider overbought RSI levels to be a precursor of a bearish trend reversal.
Hence, BTC prices might fall to test the support confluence of the 50-day EMA (purple wave) and recently flipped descending trendline near $19,800. A marketwide sell-off might result in BTC prices reaching $18,500 before recovering.
While you are here, did you know about the good news for DOGE coming out of Twitter? Read here to know more
The post CME Bitcoin Futures To BITO – BTC repeats historical price action appeared first on CoinChapter.


