

Key Takeaways:
- Stablecoin market cap declined throughout the previous year.
- The ubiquitous liquidity crunch is a strong contributing factor.
- Bitcoin price recovery is under additional pressure, with a target of $25,000.
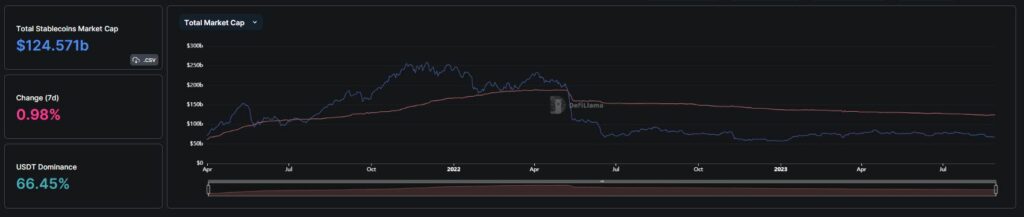
YEREVAN (CoinChapter.com) — The stablecoin sector’s collective market cap has shrunk to $123.6 billion as of Aug 28 from over $150 billion a year ago, according to crypto tracker CoinMarketCap.
Generally, stablecoins are considered the intermediary assets between leading cryptos, such as Bitcoin and Ethereum, and the fiat economy. Thus, the diminishing market cap could signify a departure from the crypto sector as a whole.
Stablecoins Slide Amid Liquidity Crunch
On-chain analyst Mile Deutscher blamed the declining market cap on a lack of inflow into the sector.
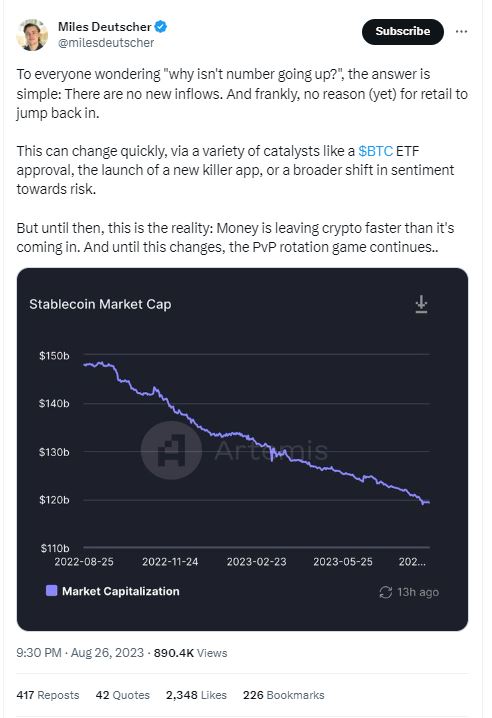
There are no new inflows. And frankly, no reason (yet) for retail to jump back in. […] Money is leaving crypto faster than it’s coming in. And until this changes, the PvP [player versus player] rotation game continues.
commented the analyst.
Additionally, stablecoins’ collective total value locked on DeFi platforms (TVL) declined parallel to the market cap slide.
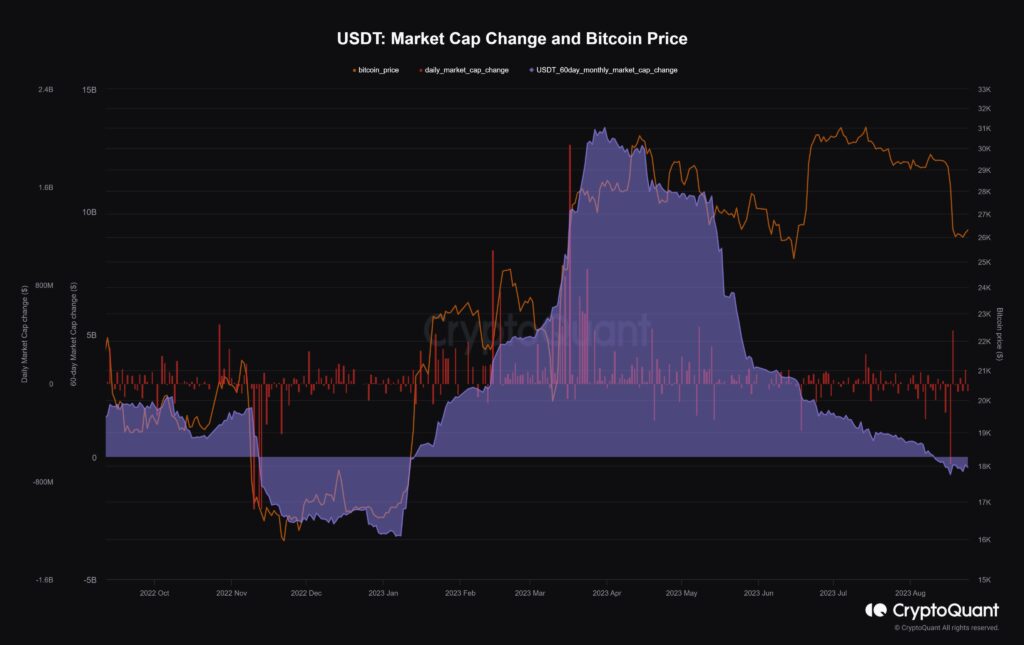
A verified author on the on-chain analytical platform CryptoQuant agreed with the outlook, examining the correlation between the market cap change of the largest stablecoin, Tether (USDT), and Bitcoin price. “Presently, there are no fresh funds in the market, limiting discussions about the potential for BTC price increases,” read the conclusion.
Meanwhile, the lack of funds is ubiquitous due to the global quantitative tightening (QT) policies. According to the latest data, central banks worldwide tightened their purse strings, cutting down on spending.
The Bank of England (BOE) shrank its balance sheet by 3% in the ongoing attempts to stave off inflation. The Federal Reserve reported a 4% reduction, while the People’s Bank of China (PBC) charts rolled back its expenditures by 5%.
Germany-based financial analyst Holger Zschaepitz also noted that in implementing continuous QT policies, the European Central Bank (ECB) balance sheet had hit €7,153 billion, its lowest point since March 2021.
Retail investors also lack the funds to spend on risk-on crypto, so the potential Bitcoin pump is at risk.
Bitcoin Risks Sliding to $25K
As mentioned, stablecoins are typically a go-between asset that links the crypto sector to the fiat economy.
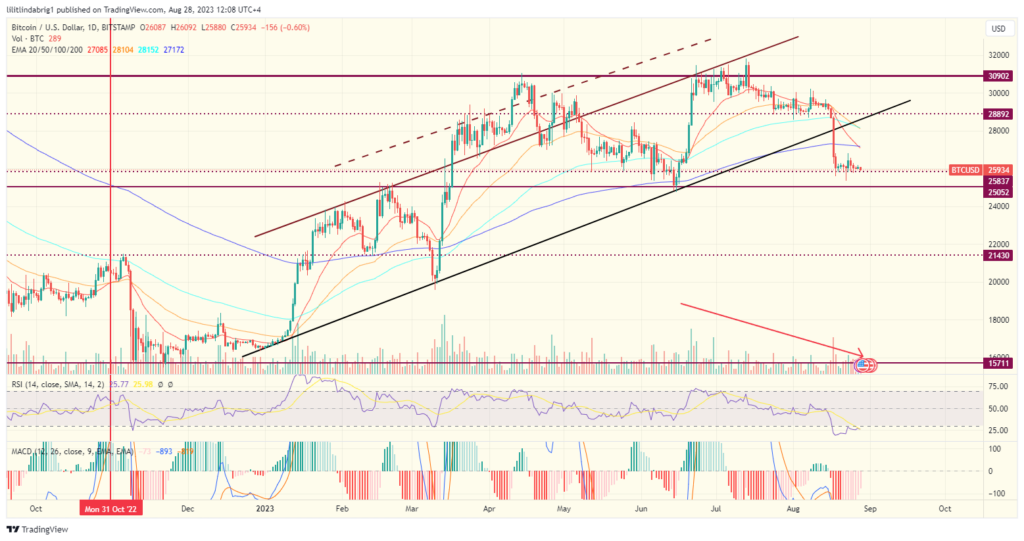
Thus, the dropping stablecoin market cap could signify more trouble for the asset class leader Bitcoin. The latter has already experienced a tough two weeks partially due to Binance liquidity woes and lost the support at $26,000 on Aug 17.
As of Aug 28, the flagship crypto bobbed just below the said line, aiming at the $25,000 support as its next target for the week ahead.
Moreover, the US Securities and Exchange Commission’s decision on the spot Bitcoin ETF from BlackRock looms on Sep 2. The agency has previously stalled the decision on a similar ETF from ARK Invest, and market participants expect another wave of delays in early Sep, with possible detrimental effects on the BTC price.
The post Drying Stablecoin Capitalization Creates More Downside Risks for Bitcoin appeared first on CoinChapter.


