

Key Takeaways:
- Ether’s price is showing bullish breakout signs above the 0.0675BTC pivot zone.
- ETH/BTC traded above a crucial bearish trend line with resistance at 0.0680BTC on the daily chart.
- The price could start a fresh rally if it stays above the 50-day simple moving average (blue).
NEW DELHI (CoinChapter.com) — Ethereum’s ETH is rising from the 0.0640BTC zone. There could be more upsides toward the 0.070BTC and 0.0725BTC resistance levels.
Ethereum (ETH) Price Signals Breakout Vs. Bitcoin
In the past few days, there was a slow increase in Ethereum vs Bitcoin. However, ETH/BTC remained well-bid above the 0.0640 zone, and the bulls were able to push the price higher.
There was a decent increase above the 0.0650 and 0.0660 levels. In addition, the price climbed above the 50% Fib retracement level of the downward move from the 0.0708 swing high to the 0.0639 low. More importantly, Ether traded above a crucial bearish trend line with resistance at 0.0680BTC on the daily chart.
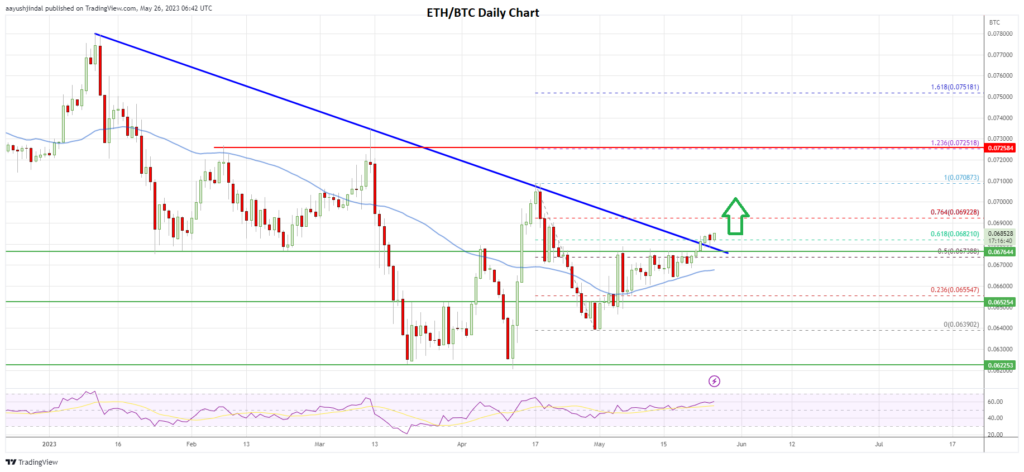
The price is now comfortably above the 0.068 level and the 50-day simple moving average (blue). On the upside, Ether’s price faces resistance near the 0.0692 level. It is close to the 76.4% Fib retracement level of the downward move from the 0.0708 swing high to the 0.0639 low.
The next major resistance is near the 0.0700 level. A clear upside break above the 0.070 resistance may start a fresh rally. The price may rise toward the 0.0725 resistance in the stated case. Any more gains might clear the path for a move toward the 0.0750 zone or even 0.0780.
Another Rejection?
Ethereum’s price could struggle to clear the 0.0700 resistance zone if not. On the downside, proper support forms near 0.067 and the 50-day simple moving average (blue).
The main support seems to be forming near the 0.0652 level. If there is a downside break below the 0.0652 support, the price might start another bearish wave. The next major support could be near the 0.0622 level, below which the price may drop toward the 0.060 support zone.
Overall, Ether’s price shows positive signs above the 0.068 resistance versus Bitcoin. If a clear move above 0.070, there could be a strong bullish reaction. Conversely, the ETH price might revisit the main 0.0652 support zone in the coming sessions.
The post ETH/BTC: Ethereum Price Shows Signs of Fresh Surge vs. Bitcoin appeared first on CoinChapter.


