

Key Takeaways:
- Ether price shows bullish breakout signs above the 50-day simple moving average (blue).
- ETH/BTC traded above a key bearish trend line with resistance at 0.0635BTC on the daily chart.
- The price could start a fresh rally if it clears the 0.0645BTC resistance zone.
Ethereum’s ETH is rising from the 0.060BTC zone. There could be more upsides toward the 0.0670BTC and 0.0700BTC resistance levels.
Ethereum (ETH) Price Eyes Fresh Increase Vs. Bitcoin
After forming a support base above the 0.0605 level, Ethereum started a decent recovery wave vs Bitcoin. ETH/BTC was able to climb above the 0.0620 pivot level to move into a short-term bullish zone.
The price above the 23.6% Fib retracement level of the downward move from the 0.0708 swing high to the 0.0605 low. More importantly, Ether traded above a key bearish trend line with resistance at 0.0635BTC on the daily chart.
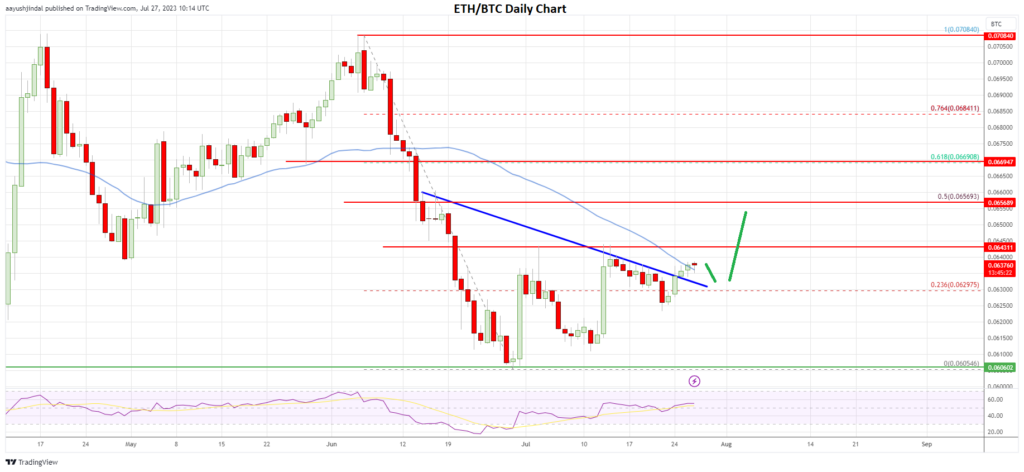
The price trades just above the 0.0635 level and the 50-day simple moving average (blue). On the upside, Ether’s price seems to be facing resistance near the 0.0645 level.
A clear move above the 0.0645 level could send Ethereum toward the 0.0655 resistance. It is close to the 50% Fib retracement level of the downward move from the 0.0708 swing high to the 0.0605 low. The next major resistance is near the 0.0670 level.
A close above the 0.0670 resistance may perhaps start a fresh rally. The price may rise toward the 0.0700 resistance in the stated case. Any more gains might clear the path for a move toward the 0.0720 zone or even 0.0750.
Another Decline?
Ethereum’s price could struggle to clear the 0.0645 resistance zone if not. On the downside, decent support forms near 0.0632 and the 50-day simple moving average (blue).
The first key support seems to be forming near the 0.0620 level. If there is a downside break below the 0.0620 support, the price might start another bearish wave. The next major support could be near the 0.0605 level, below which the price may drop toward the 0.0565 support zone.
Ether’s price shows positive signs above the 0.0630 resistance versus Bitcoin. If a clear move above 0.0645, there could be a steady increase. Conversely, the ETH price might revisit the 0.062 support zone in the coming days.
The post ETH/BTC: Ethereum Price Signals Bullish Breakout Vs Bitcoin But Lacks Momentum appeared first on CoinChapter.


