

Key Takeaways:
- Peter Brandt spotted a right-angle expanding triangle on the ETH chart.
- The formation could take the token to $2K, backed by a bull flag.
- Investors still take their funds out of Ethereum despite bullish technicals.
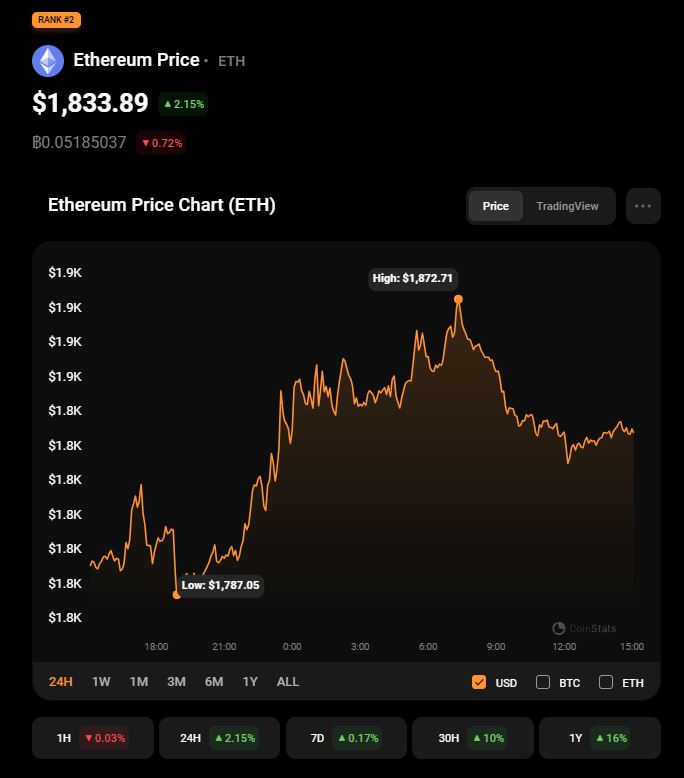
YEREVAN (CoinChapter.com) — Ethereum (ETH) traded at $1,830 on Nov. 2, after a 2% intraday slide. However, veteran Investor and economist Peter Brandt noted a rare bullish pattern called the “right-angled expanding triangle” or a broadening wedge on the Ethereum chart, which could take ETH to $2,000 in the coming sessions.
Ethereum charts hint at a 10% uptrend
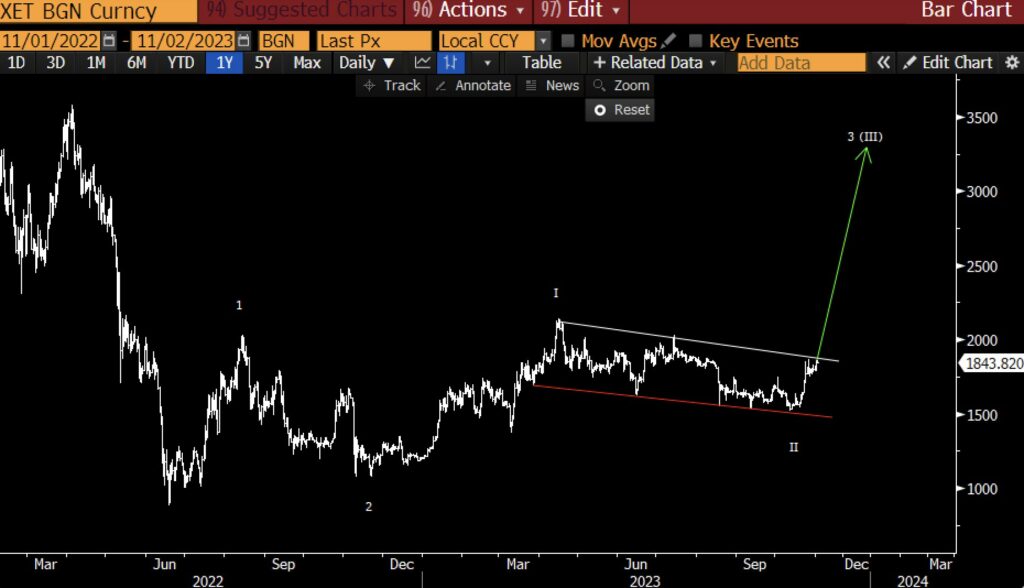
The right-angled expanding triangle features a flat resistance line and a down-sloping support.
As a result, the two trendlines expand away from each other. According to Brandt, the formation could take the Ethereum token price to just under $2,000, as ETH broke the upper trendline in mid-October, confirming the pattern’s relevance.
Generally, the expanding triangle predicts an uptrend equal to the maximal distance between the trendlines before the token broke out. Hence, the $2,000 target.
The investor emphasized the short duration of the setup (Aug 17-Oct 23) but called it a “great example of classical charting principles.”
Raoul Pal is also an ETH bull
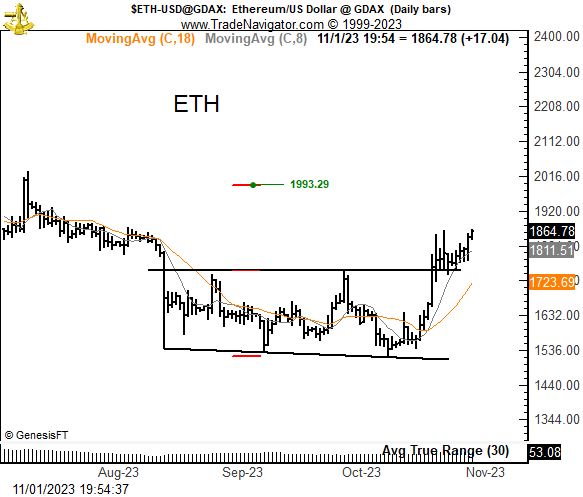
Moreover, the bullish target coincided with another expert’s opinion – Raoul Pal, who spotted a bull flag on the ETH daily chart, calling it “gorgeous.” The bull flag formation is a consolidation or a correction period after an uptrend and looks like a flag on a pole, hence the name.
The breakout from a flag often results in a powerful move higher, measuring the length of the prior flag pole. Thus, the formation’s target for ETH would stand at approximately $2,500, backing Brandt’s assumptions.
Notably, Pal is a long-haul Ethereum bull, saying the following in 2021.
For the Bitcoin Maxi’s: when ETH launched it was at 0.0007BTC. 6 years later, it is at 0.07. That is 100x vs BTC over the period you called it a shit coin. The whole Pfeffer argument of utility value goes to zero has been proven wrong due to network effects
tweeted Pal.
Investors don’t agree with the experts. Yet.
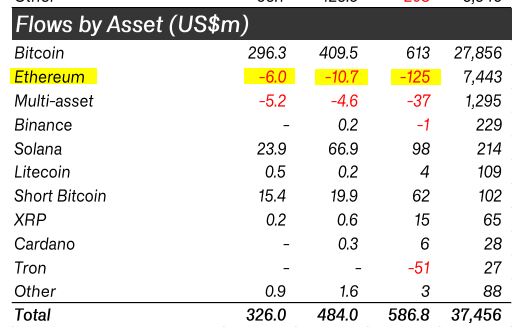
Despite the bullish technicals, investment data from CoinShares shows a consistent outflow of funds from Ethereum. Investors extracted $6 million out of ETH in the last week of October, $10.7 million in the previous month, and $125 million year-to-date.
Notably, the outflows don’t necessarily trump the bullish technicals, as investors could still veer toward the alpha altcoin in 2024. However, Ethereum enthusiasts should, nonetheless, keep a close track of on-chain metrics along with the technicals to get a clearer picture of where ETH is going.
Have an Ethereum analysis of your own? Share it in the comment box below and get featured in our next Ether articles.
The post Ethereum (ETH) $2K Target is Back in Play Baby appeared first on CoinChapter.


