

Key Takeaways:
- Staked ETH reached a new all-time high despite Ethereum’s latest update
- Bulls struggled to revive the token price rally.
NEW DELHI (CoinChapter.com) — Ethereum’s latest Shanghai update had sparked fears of ETH tokens flooding the markets as stakers moved to book profits after withdrawing their staked tokens. However, it seems the fears were unwarranted.
In a post, blockchain analysis firm Nansen shared that the amount of locked ETH had reached a new ATH of 19.3 million tokens. The firm noted that the withdrawal frenzy following the Shapella update became insignificant in the longer timeframe.
Locked ETH refers to Ether tokens staked on the Beacon chain, ETH that is “out of circulation,” rewards on the Beacon chain, and “ETH deposited to the Beacon contract but not validating yet,” as per Nansen.
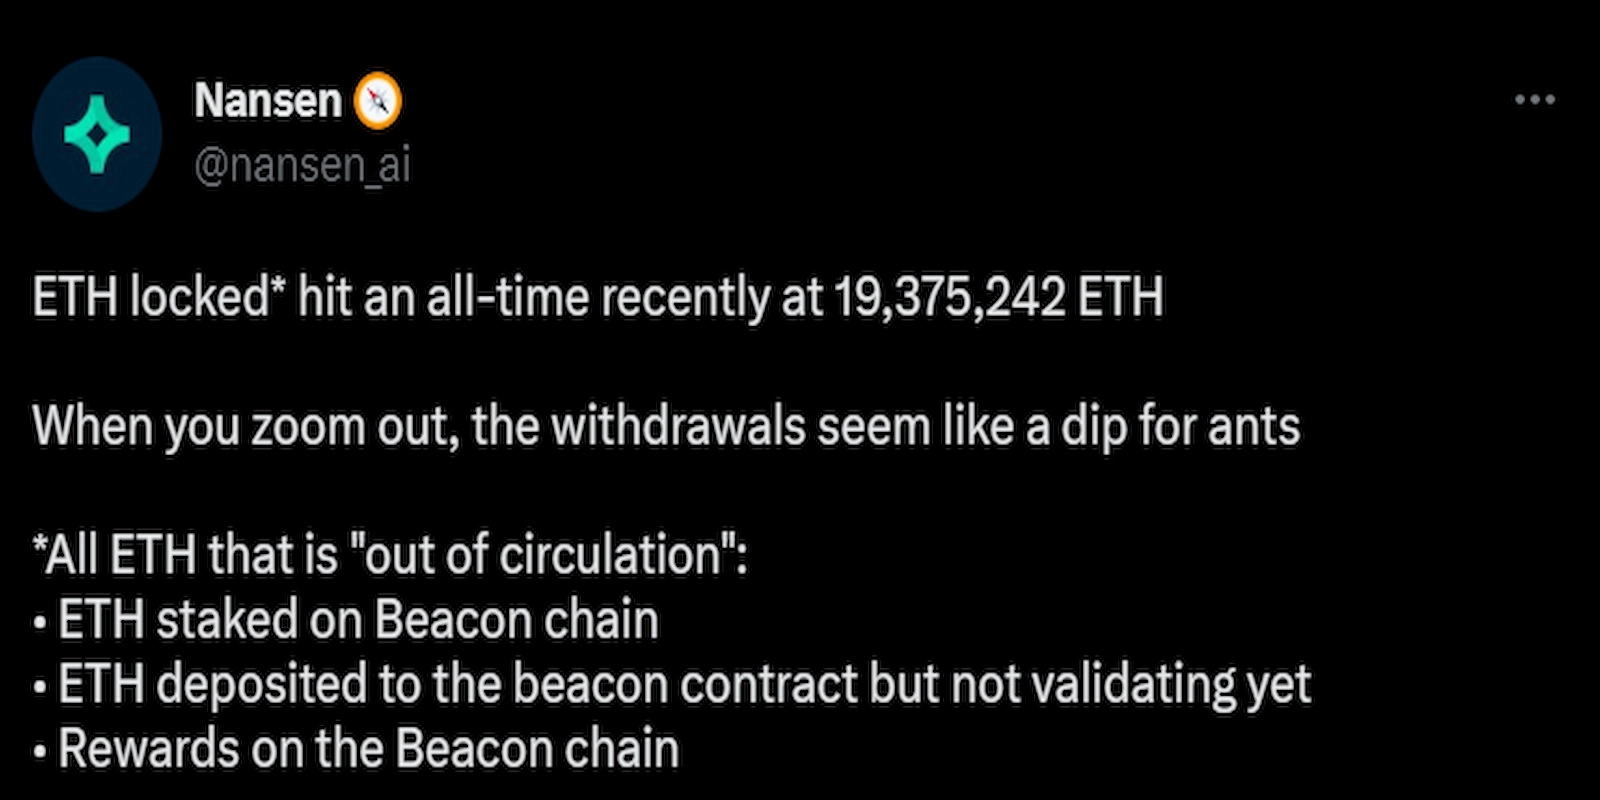
Interestingly, the current amount of ETH locked on the Beacon chain is equivalent to the amount during the Shapella update, suggesting the net impact of withdrawals has been zero. Furthermore, full withdrawals overtook partial withdrawals.
Partial withdrawals involve accrued awards, while full withdrawals are withdrawals of the entire 32 ETH balance necessary to become a validator on the blockchain. To enable withdrawals, validators must set their withdrawal credential prefixes to 0x01 from 0x00.
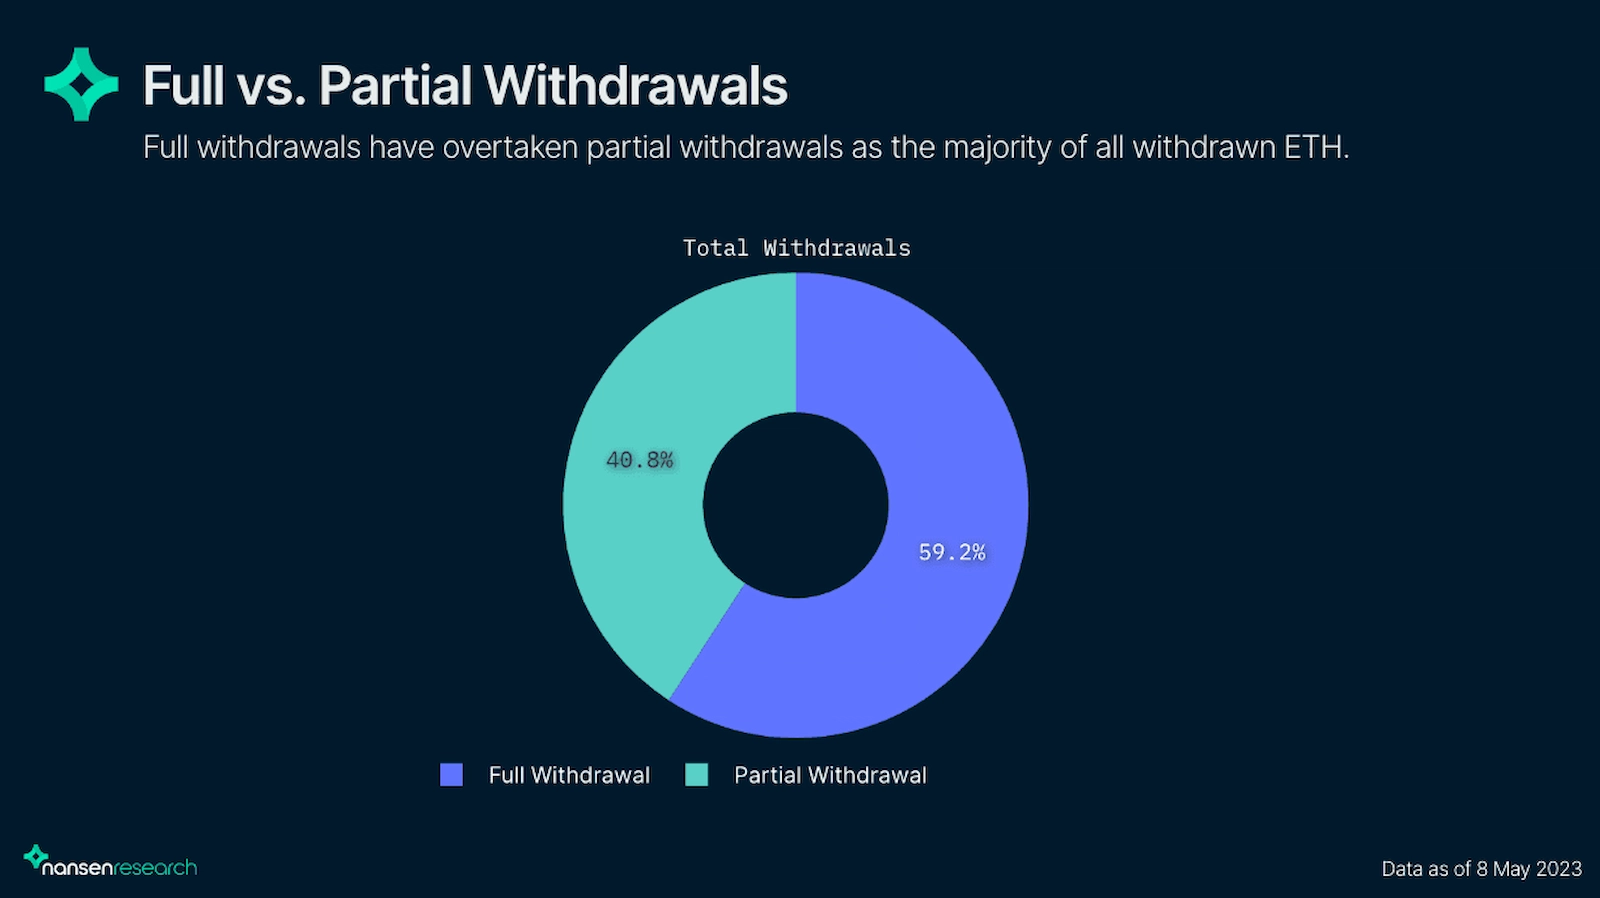
Full withdrawals now represent 59.2% of the total ETH withdrawal. An increase in full withdrawals suggests exiting validators now make up most of the withdrawal. Meanwhile, Kraken has one of the highest withdrawal volumes.
Also Read: FTX CEO Sam Bankman-Fried (SBF) Wants Court to Dismiss Criminal Charges Against Him
The exchange accounted for nearly 26.3% of all withdrawals, with users withdrawing 647,000 ETH. However, Kraken’s contribution might be due to the recent regulatory crackdown, which forced the exchange to shutter its staking operations.
ETH Price Forms Bullish Pattern
ETH price has been moving inside a bullish technical pattern called the ‘Ascending Triangle.’
A horizontal trendline that connects swing highs and an ascending trendline connecting swing lows forms the pattern. Volume helps determine if a breakout is strong.
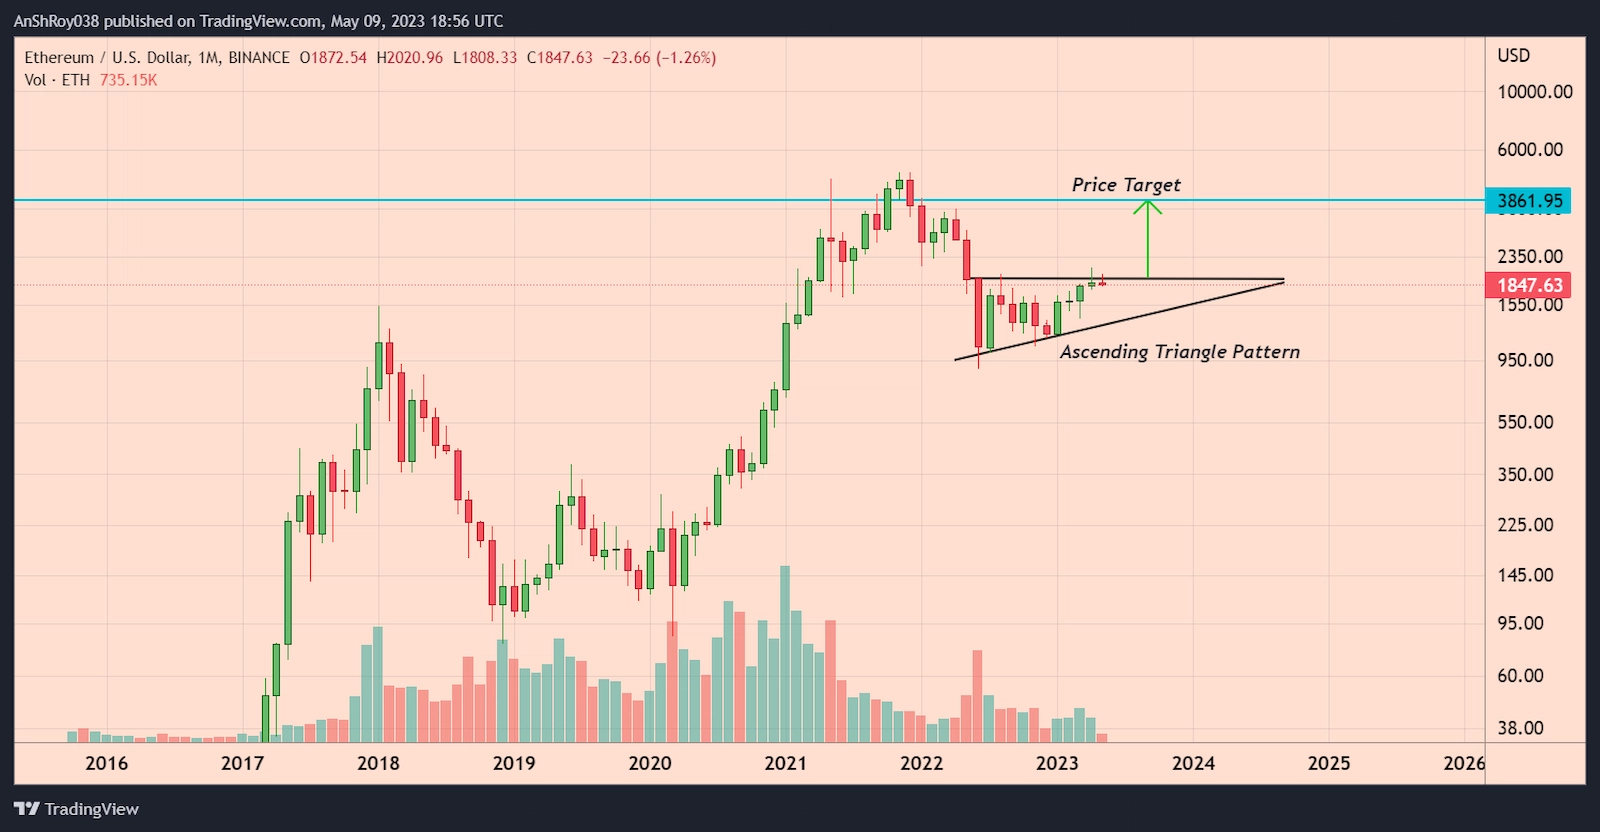
In an ideal world, buyers would enter the market as the trendlines close the gap, pushing prices above horizontal resistance with heavy volumes. Unfortunately, a low-volume breakout on the upside will likely fail, resulting in a pullback.
Per the rules of technical analysis, the price target for a breakout is equal to the triangle’s height at its thickest point. Therefore, ETH price might rise to $3,862 after confirming the pattern, a jump of 109% from its current price levels.
Ether Price Struggled To Start A Rally
Locked ETH reaching a new record high should ideally be bullish for the Ether token’s price since it means a lesser supply of ETH in the market. A decline in supply often helps a digital asset start a bullish rally.
However, ETH price remained decidedly bearish. The Ethereum token extended its downtrend that began on May 6, falling nearly 9% from May 6’s high of $2,021 to form a daily low of $1,843 on May 9.
Moreover, bulls failed to defend the 50-day EMA (purple wave) support level. If the downtrend continues, ETH price might drop to test the immediate support level near $1,810, the Ether token has tested multiple times since April 4.
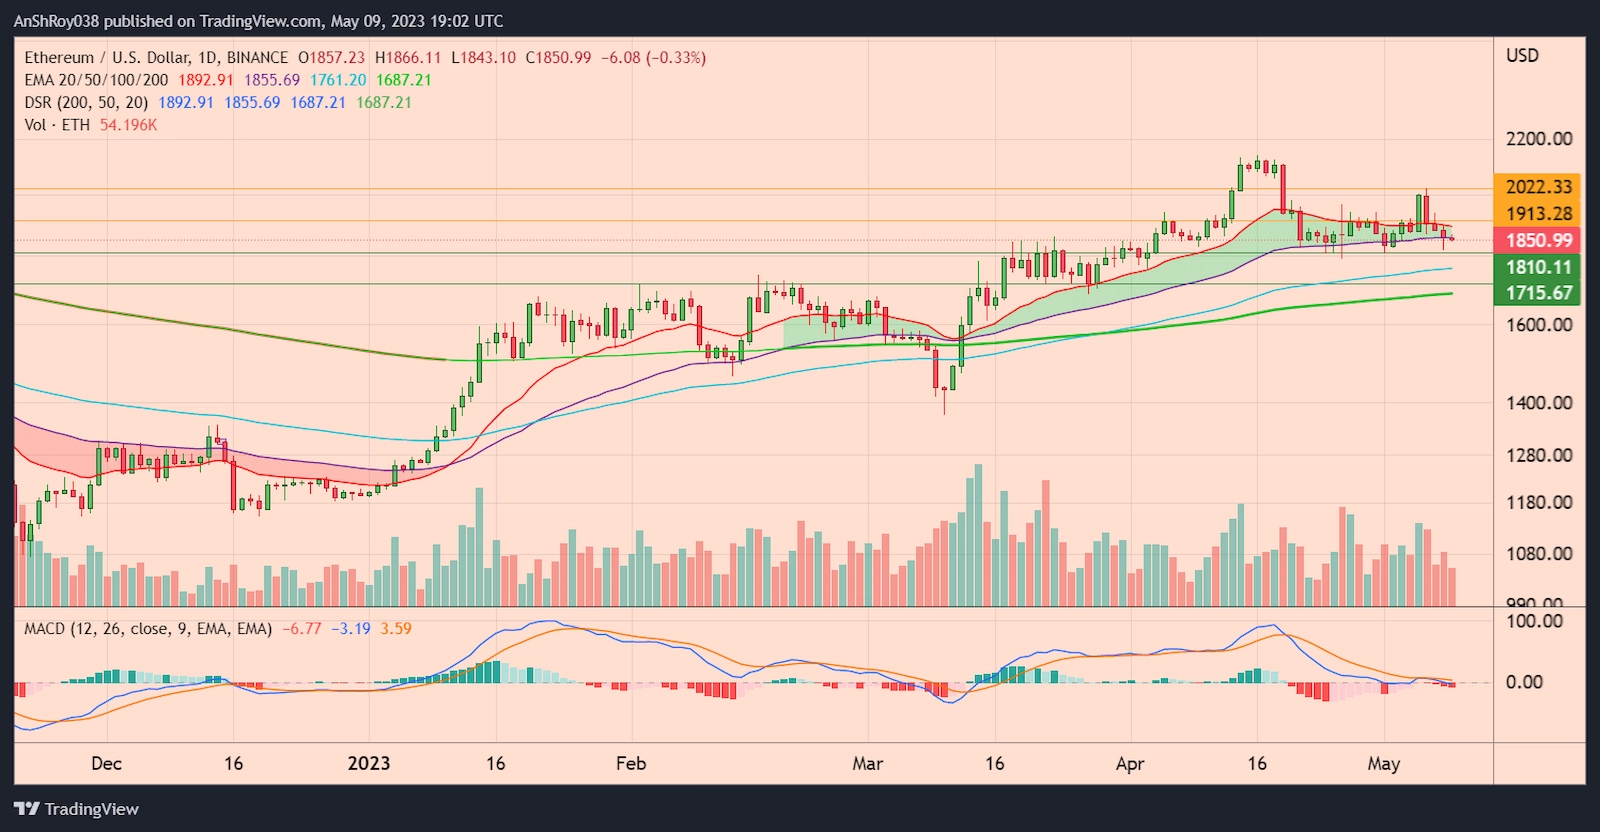
Moreover, breaching the immediate support level could force ETH price below its 100-day EMA (blue wave) to test support near $1,715.
Trend-based momentum oscillator MACD continues to be bearish for ETH. The MACD histogram indicates that the MACD line (difference of 12-day and 26-day EMA) is moving away from its MACD signal line (9-day EMA of MACD).
Hence, a divergence in MACD lines might indicate market participants remained divided.
Conversely, an uptrend would require bulls to force ETH above its 20-day EMA (red wave) resistance near $1,910. Additionally, breaking and consolidating above its immediate resistance level could help the Ethereum token price rise to target resistance near $2,020 before retreating.
The post Ethereum Locked Reaches All-Time High As ETH Struggles To Rally appeared first on CoinChapter.


