

Key Takeaways
- Ethereum has rallied 14.5% this week already.
- Spot crypto ETF keeps bullish hopes alive across the market.
- Nonetheless, technicals indicate a 20% drop underway for Ether.
YEREVAN (CoinChapter.com) — Ethereum’s native token, Ether (ETH), looks ready to drop sharply in the coming months despite logging an impressive ‘Uptober‘ rally.
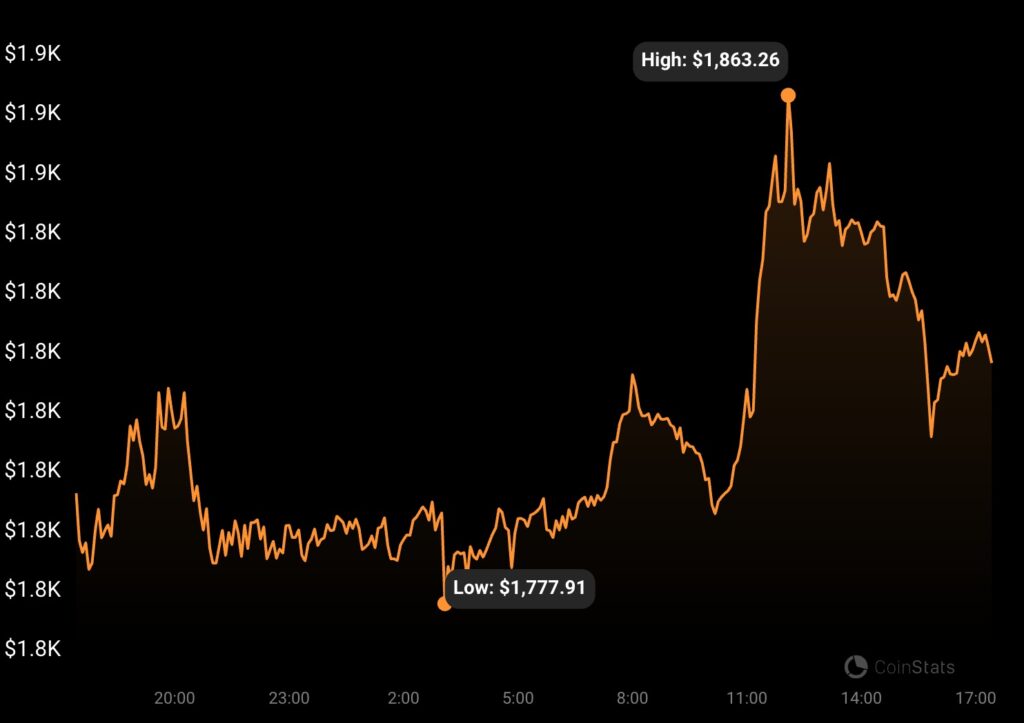
As of Oct. 26, ETH’s price rallied nearly 14.5% week-to-date to $1,865, its highest level over two months.
The Ethereum token’s gains came on the heels of uplifting news updates, primarily the US Securities and Exchange Commission’s (SEC) decision to review Grayscale Investment’s application to convert its Ethereum trust into an exchange-traded fund (ETF).
Ether’s gains also picked cues from the listing of BlackRock’s Bitcoin ETF ticker on the Depository Trust and Clearing Corporation’s (DTCC) official website. Traders treated the listing as a sign of a potential spot Bitcoin ETF approval in the US, an interpretation later rubbished by a top Bloomberg analyst.
Ethereum Price Hits Key Resistance Confluence
Ethereum now picks a battle with a resistance confluence comprising a descending trendline and a Fibonacci retracement line.
Notably, the descending trendline at around $18,65 is part of what appears to be a bull flag. And the Fib line is near $1,940, which, in turn, is part of a Fibonacci retracement graph drawn from a swing high of $4,795 and a swing low of $1,054.
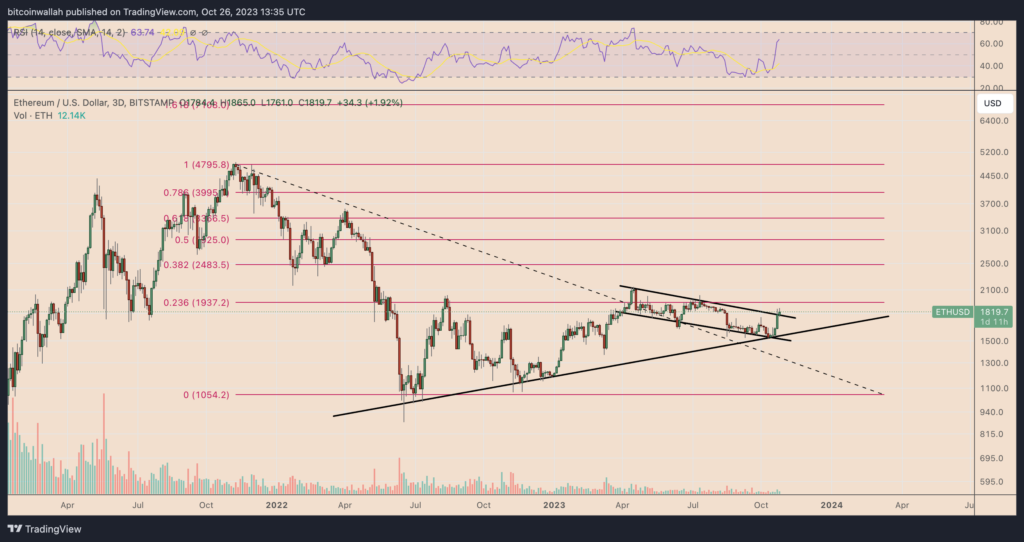
The best-case scenario in the short term enables Ether to continue its ongoing bull run toward $1,940. However, the Ethereum token will remain under pullback risks after testing the said resistance level, thus eyeing a return inside its prevailing bull flag range.
Suppose ETH’s price pulls back. Then, its likelihood of correcting toward the flag’s lower trendline, which coincides with its ascending trendline support, will be higher. Simply put, Ether can drop 20% to $1,550 by the end of November 2023.
The Bull Case
Ether’s next correction does not mean an end of its prevailing bull trend. On the other hand, the Ethereum token shows signs of continuing its upside run as long as its bull flag stays intact. That is because bull flags are bullish continuation patterns, as shown below.
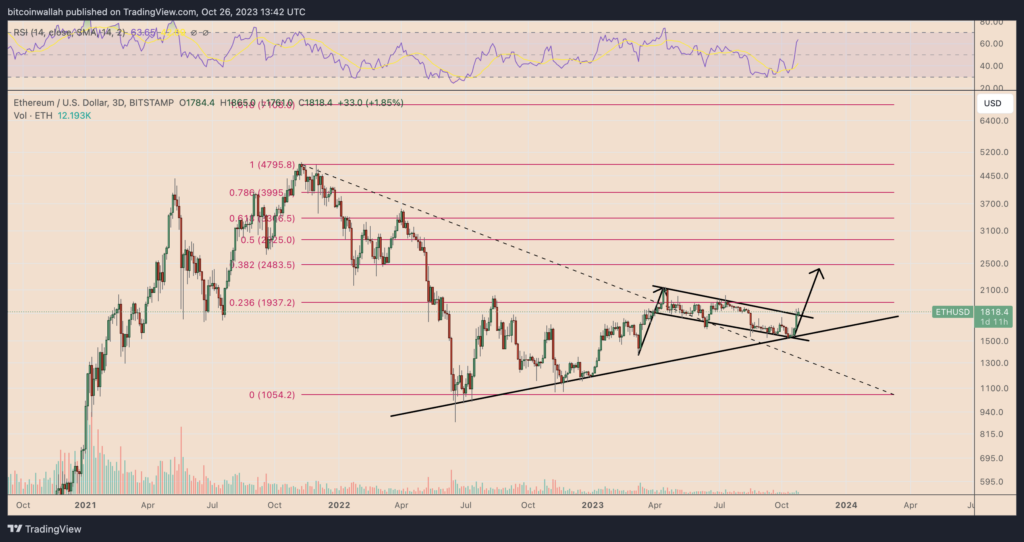
Therefore, the price merely needs to break above the flag’s upper trendline decisively to finish 2023 at around $2,500.
The post Ethereum Making Moves to Push ETH Price Down 20% appeared first on CoinChapter.


