

NEW DELHI (CoinChapter.com) — Ethereum (ETH) price monthly chart shows a decisive uptrend ahead in December and the first quarter of 2024. Notably, the cryptocurrency is setting up for a medium-term uptrend above $2,000, followed by a breakout toward $2,850 or $3,350.
Ethereum Price Months Chart Shows Strength
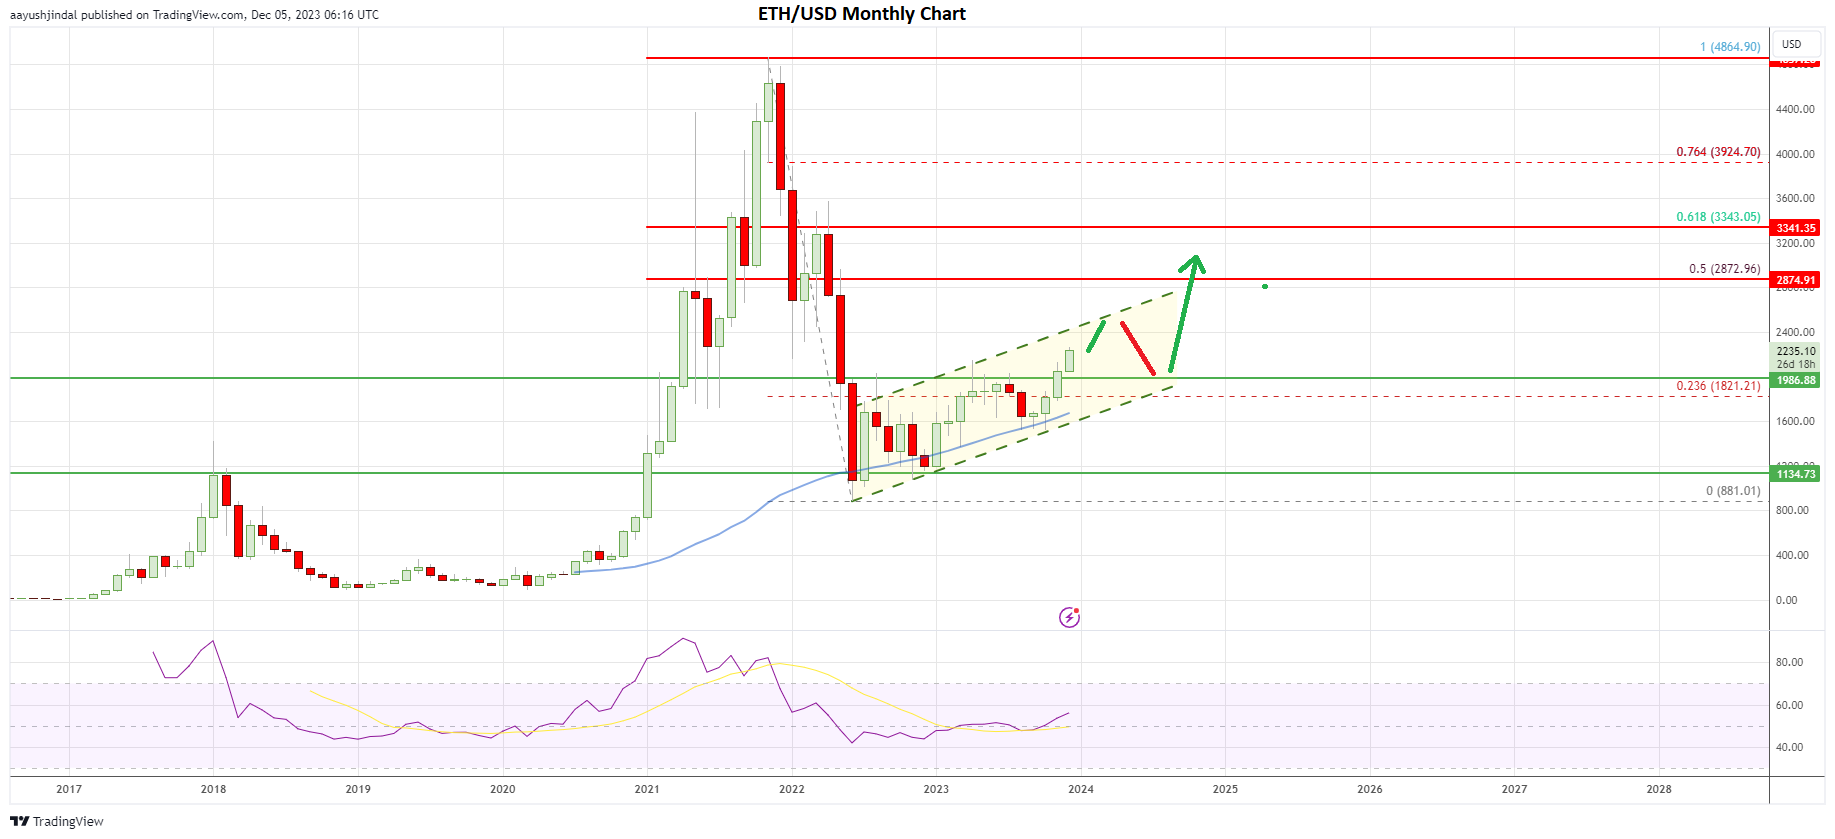
In the last four months, the Ethereum price monthly chart has formed a base and started a strong increase from $1,600. ETH remained stable above the 50-month simple moving average (blue). The bulls could pump the price above the $1,500 and $1,600 resistance levels.
There was a move above the 23.6% Fib retracement level of the main downtrend leg from the $4,864 swing high to the $881 low. The price is now following a rising channel with support at $1,980 on the monthly chart.


The last three-monthly candles were all bullish, and the current price action calls for more upsides. Ethereum settled above the $2,000 pivot level to start a steady uptrend.
Bitcoin is also signaling a fresh uptrend above the $40,000 level. If BTC continues to grind higher, it could take altcoins, inc,luding ETH. On the upside, ETH/USD faces resistance near the $2,320 level. The first major resistance is near the channel trend line at $2,400.
It could face selling interest if the price reaches the $2,400 resistance. In the stated case, the price might start a downside correction. The first major support is near the $2,050 zone (the recent breakout zone and a multi-touch region).
If the bulls fail to protect the $2,050 support, Ethereum might decline further and test the rising channel support at $1,980 or $2,000. A downside break below the channel support might impact the current uptrend and encourage sellers to lower the price.
The next key support is $1,650 and the 50-month simple moving average (blue). Any more losses might call for a test of $1,250.
Short-term Dips in ETH?
Conversely, Ethereum price monthly chart shows its may continue to rise above the $2,320 and $2,400 resistance levels. The next key resistance sits near the $2,880 or 50% Fib retracement level of the main downtrend leg from the $4,864 swing high to the $881 low.
It could extend its rally if the bulls successfully cleared the $2,880 hurdle. The price could rally toward the $3,350 level in the stated case. Any more gains may send ETH toward the $4,000 resistance zone.
Overall, Ethereum price monthly chart is forming a medium-term uptrend above $2,000. If the bulls remain in action, the price could drift toward $2,880 or even $2,350 in the coming weeks. Conversely, ETH might retest the $2,050 support.
The post Ethereum Price Monthly Chart – ETH Set For 50% Leap In Coming Weeks appeared first on CoinChapter.


