

ETH’s price outlook suggests that the bulls could break through the general resistance and reach prices above $4,000.
Ethereum’s price broke through general resistance at $ 3,350, with the rise seeking to bring the ETH/USD pair to prices that have not been seen since May 19, when the cryptocurrency traded above $3,400.
While the pressure that saw eEther’s value reach $ 3,100 over the weekend remains present, an upward resolution to the uncertainty shown on the daily chart would likely allow the second-largest crypto in terms of market capitalization to trade at its highest price level since mid-May.
At the time of writing, Ethereum’s price hovers around $ 3,352, which puts the ETH/USD pair just above the resistance line of an ascending triangle pattern.
Ethereum is experiencing an increase in institutional flows
The surge in Ether’s price comes as the altcoins market sees a second week of capital inflows, according to data from asset manager CoinShares.
According to the company’s weekly report released yesterday, altcoins-based assets recorded capital inflows of $ 24 million, up from the $ 21 million added in the previous week. Among altcoins, Ethereum recorded inflows of $ 17.2 million, representing about 25% of assets under management (AUM).
Outside of Ethereum, other altcoins that saw a second week of inflows are Cardano (ADA) and Solana (SOL), which recorded $ 10.1 million and $ 2.7 million inflows respectively.
The increase in inflows into digital asset investment products suggests bullish sentiment from institutional investors in altcoins, with Ethereum and Cardano likely to see further price increases as demand increases.
ETH/USD price outlook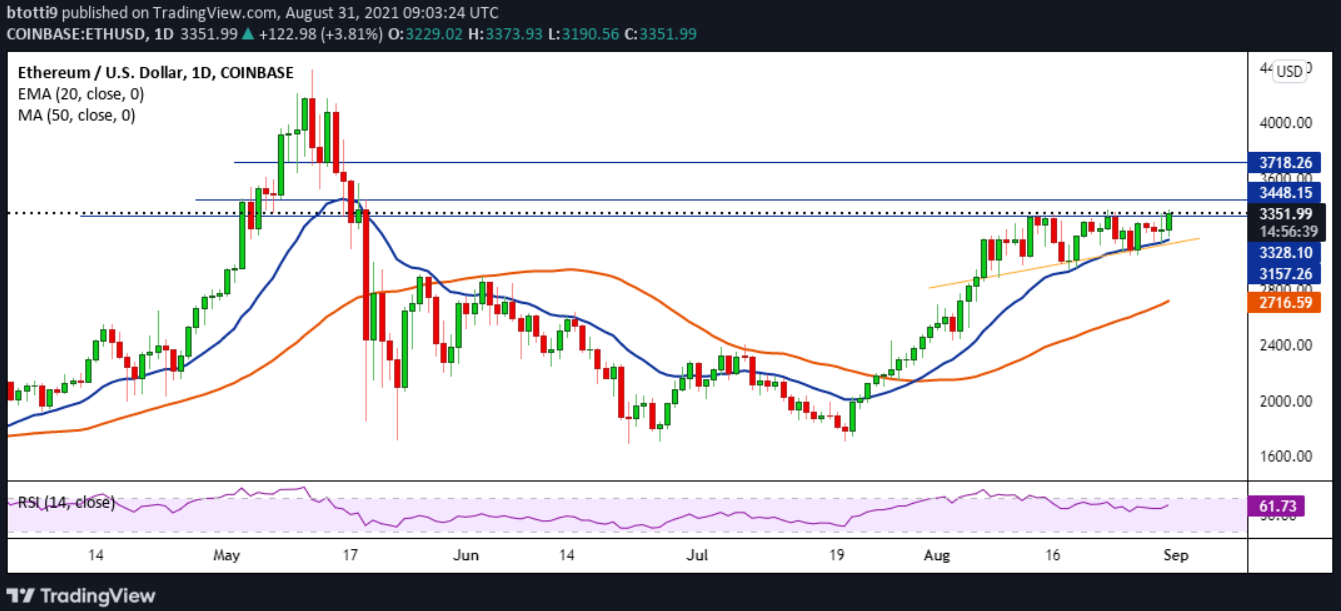
Daily chart of ETH / USD. Source : TradingView
A look at the daily chart shows that the price of Ethereum has broken above the resistance line of an ascending triangle with a barrier at $3,328. The price moved away from intra – day highs around $ 3,374, the same price level that blocked attempts to break higher on August 23.
If buyers turn the resistance line into support, the next goal would be around $ 3,448, then $3,718. Further pressure from the buyer side could then push Ethereum towards $4,000.
On the downside, ETH / USD could retest the support of the ascending triangle, which coincides with the 20-day exponential moving average curve around $3,157. Below this level, the decline could focus on the horizontal support around $ 2,900 and then on the 50-day moving average line around $2,716.


