

Key Takeaways:
- Ethereum’s supply rate has dropped below the Bitcoin supply rate.
- ETH’s price failed to hold the $1,800 price level.
NEW DELHI (CoinChapter.com) — Ethereum’s supply rate has dropped below the Bitcoin supply rate, suggesting the deflationary methods of the platform might be working. In addition, the Ether burning mechanism has removed nearly 66,000 ETH tokens from supply in 2023.
Investors often consider a drop in supply as a bullish cue. However, a decreased supply might be just one side of the coin. A limited supply could only impact ETH price if the demand increases correspondingly.
Meanwhile, Ethereum saw the second-highest outflows in the week ending March 19, with Bitcoin leading the outflows with nearly $113 million. The outflows contradict the wider market price action, which recently saw BTC and ETH price chart multi-month highs.
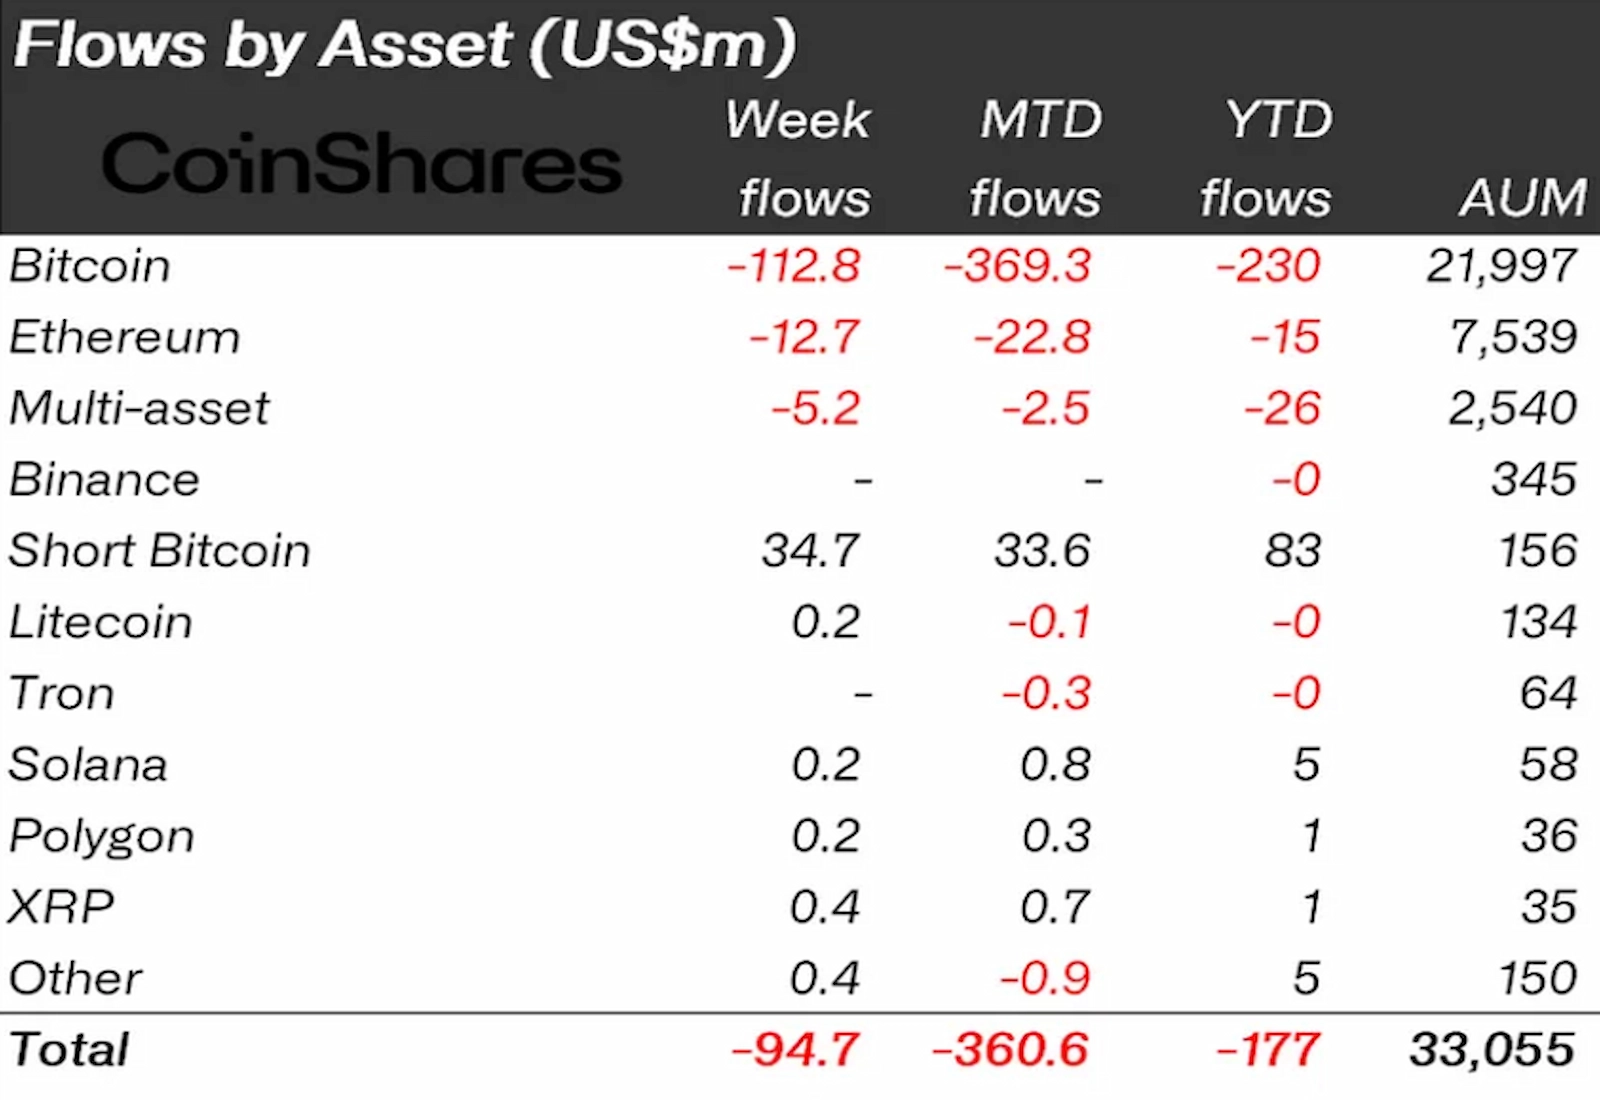
The ongoing banking crisis could be a reason behind the outflows, as traders might have turned to crypto assets for liquidity.
Related: Ethereum Price Is About to See “Liftoff” if It’s Able to Hold One Crucial Level
Moreover, the number of active addresses on the blockchain platform has declined over the past 12 months. The decrease in active addresses suggests traders and developers might be looking at Ethereum alternatives.
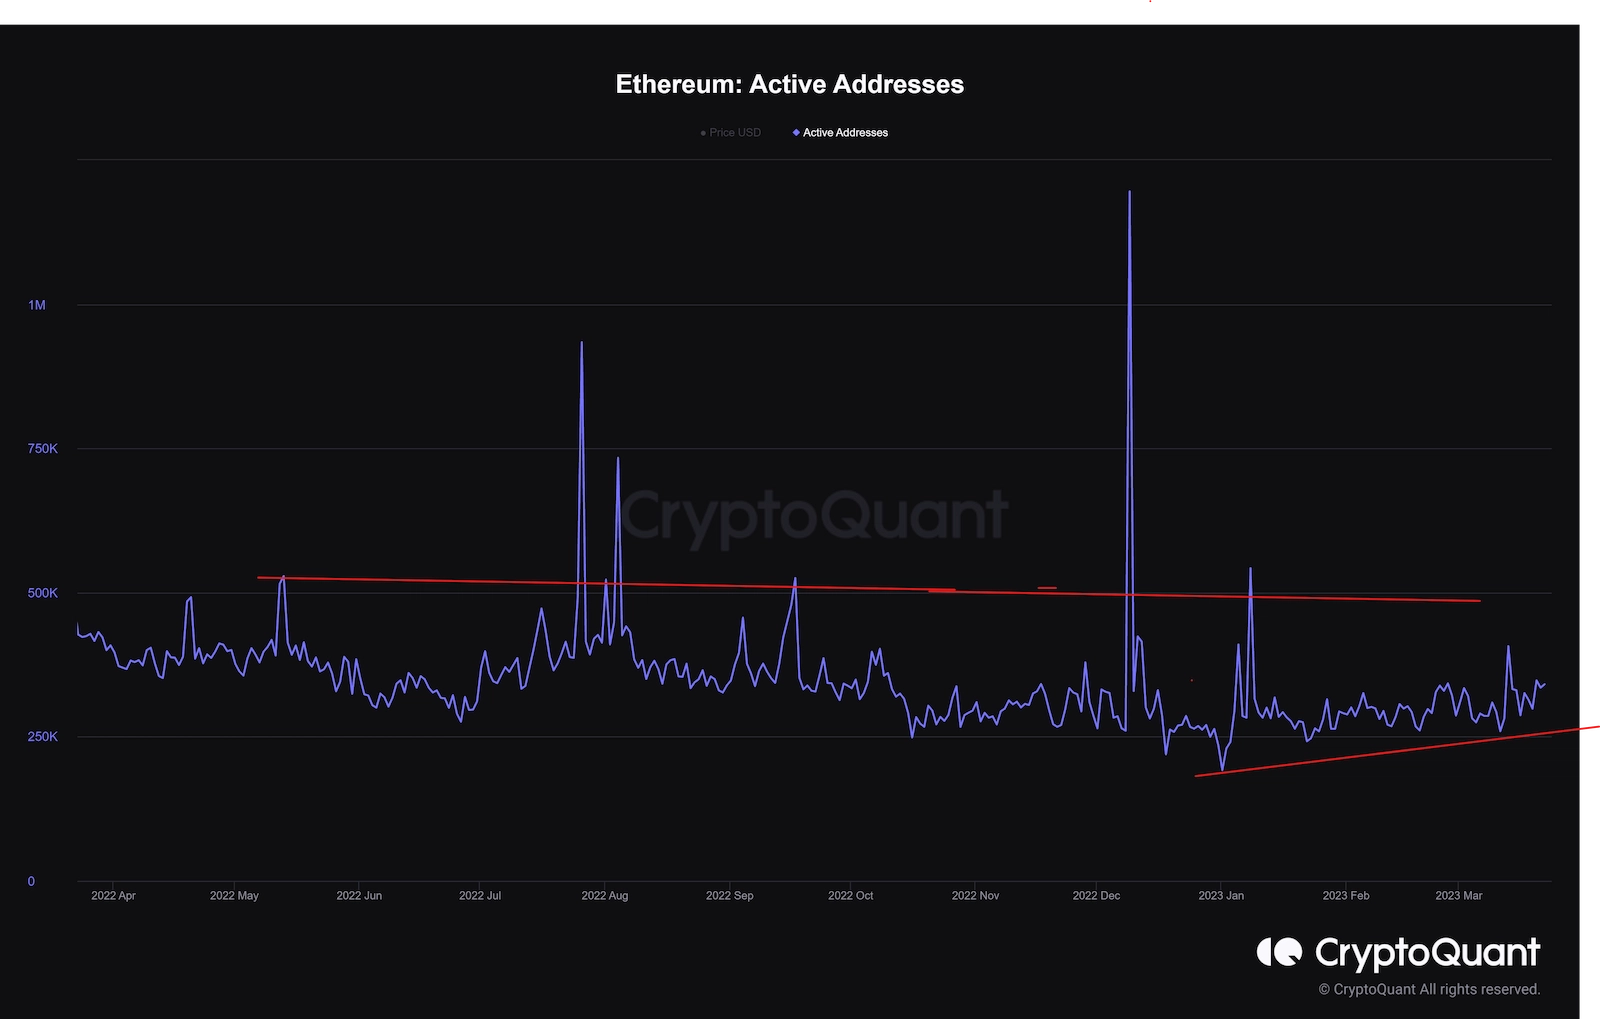
However, zooming in on the chart shows that active addresses have been rising in 2023. Introducing Zk rollups might be a reason for developers and traders to return to the blockchain, boosting demand.
Thus, the decreasing ETH supply could boost the prime altcoin’s prices, granted demand continues to rise. However, bearish risks for the Ether token arise from a bearish pattern in which the price moves.
ETH Price Fails To Hold Above Key Resistance
Meanwhile, the ETH price reached its higher level since Aug 2022 on March 19. However, long upper wicks on the Ether’s daily suggest that bears are aggressively defending the $1,800 price. As a result, the prime altcoin dropped nearly 4% to close on March 22 at $1,739.
Moving above the key resistance level near $1,800 is vital for the ETH price to begin a confident uptrend. Moreover, breaking and consolidating above the immediate support level would help the Ether token price to rise to $1,960 before downside corrections pare gains.
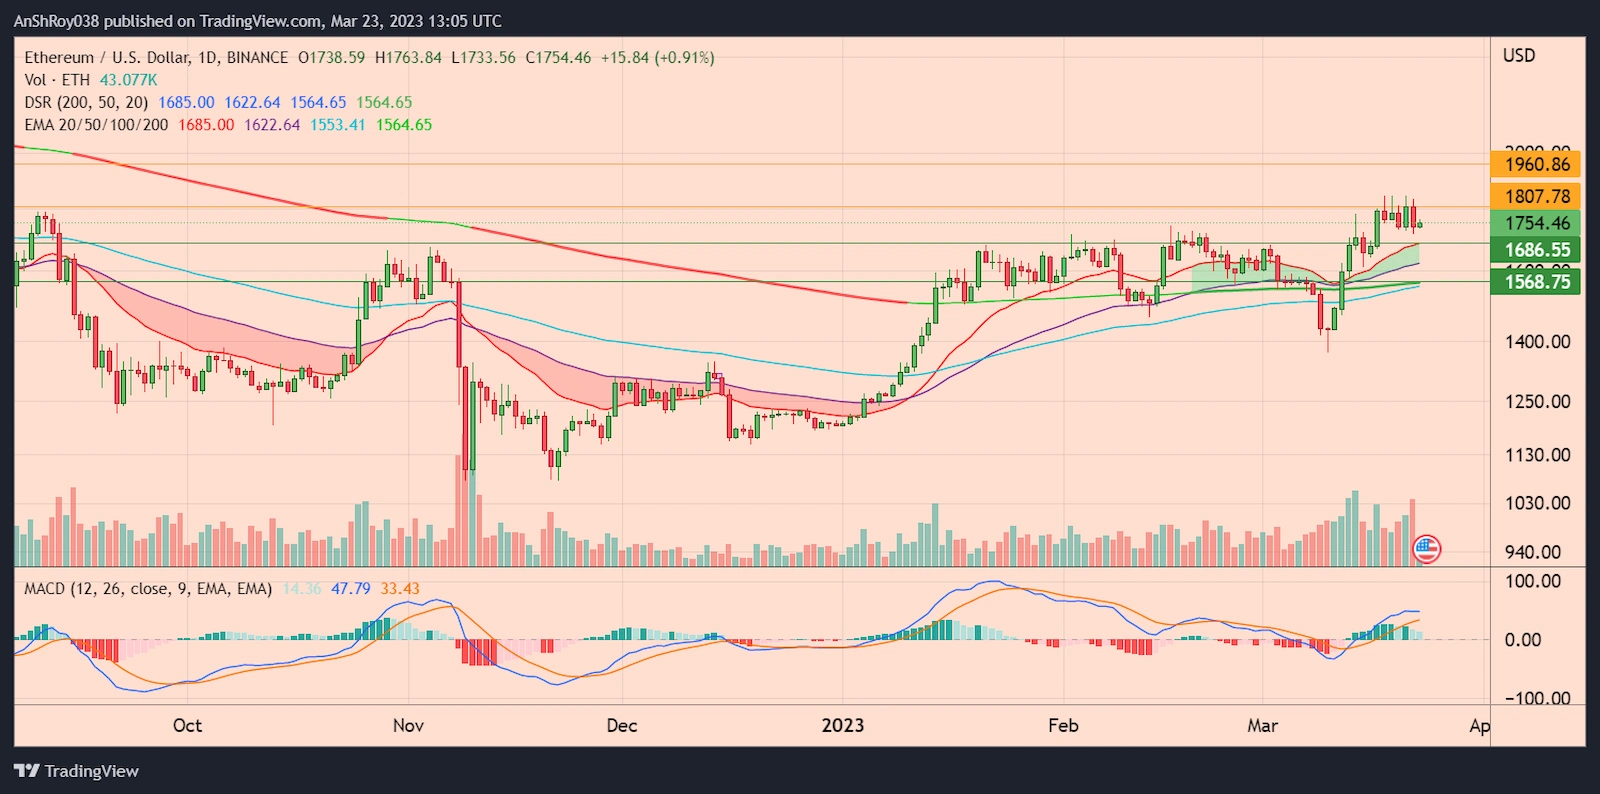
Meanwhile, the momentum oscillator MACD is turning bearish for Ethereum’s in-house token. Bars on the MACD histogram are contracting, indicating the MACD line (difference between 12-day and 26-day EMA) moves toward the MACD signal line (9-day EMA of MACD).
If the MACD line crosses below its signal line to form a bearish crossover pattern, selling pressure against ETH could increase.
If a bear run begins, ETH bulls would likely try to defend the 20-day EMA (red wave) support level near $1,690. However, breaching the immediate support could result in the ETH price crashing to $1,570, near its 200-day EMA (green wave) and 100-day EMA (blue wave) support confluence, before recovering.
The post Ethereum Supply Rate Drops Below Bitcoin, Will ETH Price Respond? appeared first on CoinChapter.


