

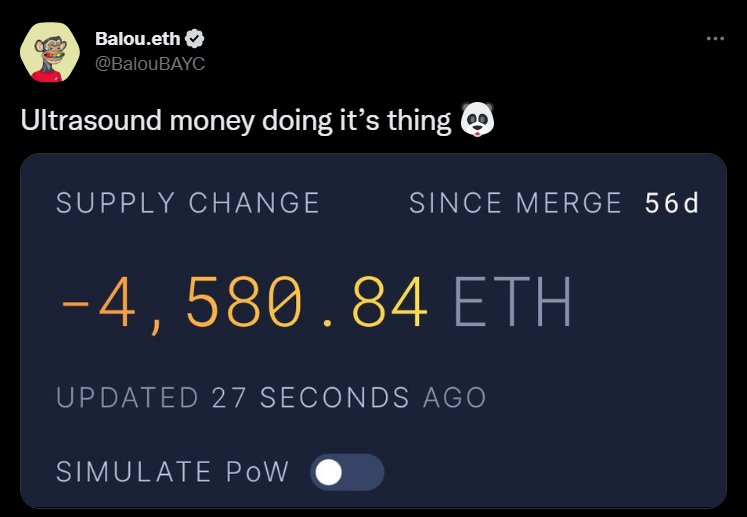
NEW DELHI (CoinChapter.com) — ETH, the world’s largest altcoin by market cap, has again turned deflationary. More ETH tokens are being burned than new ones issued, with the latest deflationary turn coming amid the recent crypto market crash.
The recent crash also saw a spike in transaction fees on ETH as traders rushed to exchanges to either buy the dip or panic sell. To recap, the Ethereum network introduced a token-burning mechanism with the EIP-1559 upgrade in Aug 2021.
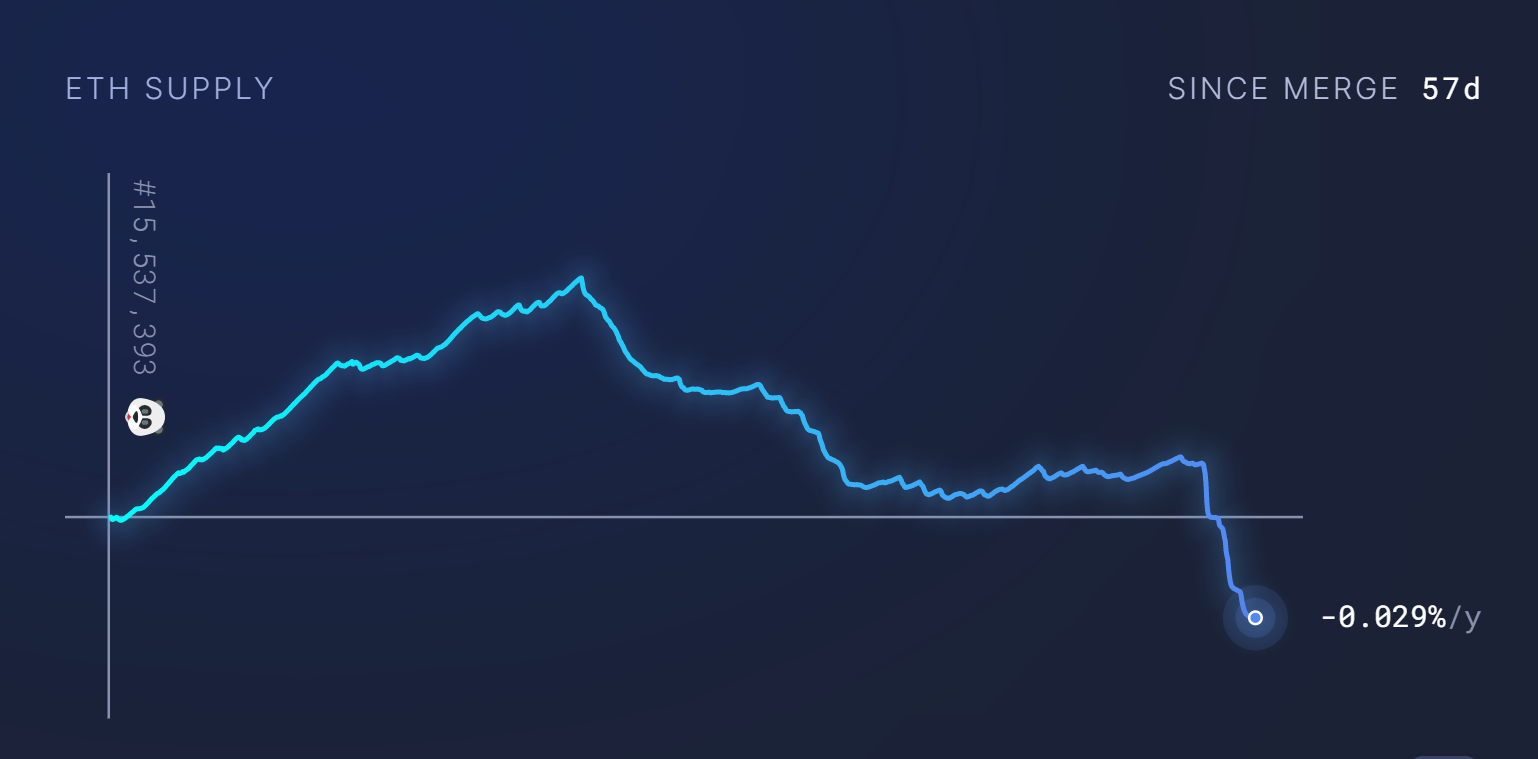
Per data from the ETH tracking platform, Ultrasound.money, ETH supply began to decline on Oct 8 for the first time since the Merge. The prime altcoin’s supply has crabbed for some time since Oct 22. However, the supply dropped sharply since Nov 8 and turned negative on Nov 9.
ETH becoming deflationary has its supporters spouting its virtues as “ultrasound money.”
For the uninitiated, ultrasound money is a humorous take on ETH’s virtue as a digital currency. If gold, with its capped supply, is “sound” money, then a deflationary supply Ether is “ultrasound” money.
Ethereum (ETH) Price Paints A Death Cross
However, the reduction in ETH supply was accompanied by a sharp drop in the altcoin’s price. Ether dropped nearly 32% from Nov 8’s high ($1,578.2) to a low of $1,073 on Nov 9. Although ETH recovered on Nov 10, the token would need more bullish cues apart from becoming deflationary.
Also Read: Ethereum Price (ETH) Recovery Could Turn Attractive To Sellers, USDT Depegs
Ethereum (ETH) price did recover some lost ground on Nov 10, gaining nearly 18%. However, the Ethereum token fell 6.7% on Nov 11 between intraday high ($1,305) and low ($1,218) levels. But the long lower wick on the day’s candle indicates bulls are active near the lower price range.
The ETH token’s 20-day EMA (red wave) needled below its 50-day EMA (purple wave) to form a bearish technical pattern called the death cross. Traders consider the pattern an indicator of negative market sentiment and a sell signal.
Hence, if the ETH price continues downward, the token might fall to test support near $1,240. Moreover, a marketwide sell-off might force Ether’s price to reach $1,130 before recovering.
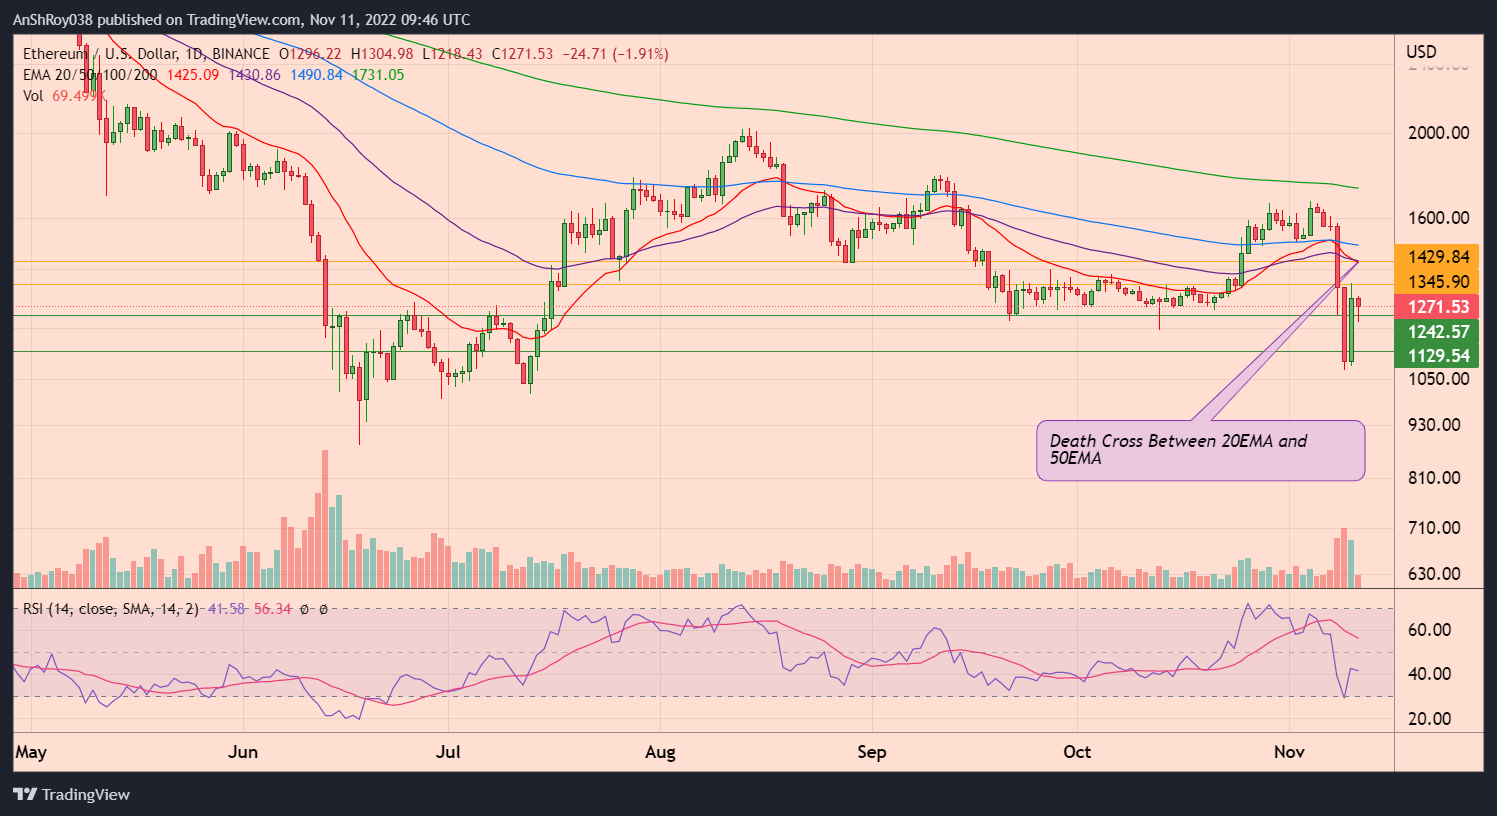
Meanwhile, the relative strength index for Ether rebounded off the oversold threshold on Nov 10 as ETH price reacted in a textbook manner. Traders consider oversold RSI levels as an indicator of a bullish trend reversal and a buy signal.
The ETH RSI is currently neutral, clocking at 41.58 on the daily charts.
If bulls push the token’s price up, ETH price might rise to resistance near $1,350. Furthermore, a break and hold above immediate resistance would help Ether price challenge the 20-day EMA and 50-day EMA resistance confluence near $1,430 before downside corrections pare gains.
Pissed about the recent FTX bank run? Take a look at these three bank runs before denouncing crypto.
The post Ethereum Turns Disinflationary For The First Time Since Merge appeared first on CoinChapter.


