

PATNA (CoinChapter.com) — Demand for Ethereum (ETH) seems to rise as on-chain data shows Ethereum whales locked in a hodling pattern
In a Nov. 14 X post, on-chain data provider Lookonchain noted that a whale address ‘0xee47‘ had accumulated 3,200 ETH tokens (worth $6.7 million at the time). The address started accumulating Ethereum tokens in July 2022 and currently holds over 183,700 ETH tokens.
Meanwhile, Ethereum investment vehicles saw inflows of $3.3 million in the week beginning Nov. 13, per CoinShares report, indicating institutional interest in the prime altcoin.
Ethereum Whales Moving Tokens Out Of Exchanges
Furthermore, blockchain intelligence platform IntoTheBlock highlighted ETH exchange outflows between Nov. 13 and Nov. 18 reached $320 million. The platform added that ETH exchange outflows crossed $1 billion in three weeks ending Nov. 18, though it did not comment on Ethereum whales’ involvement.
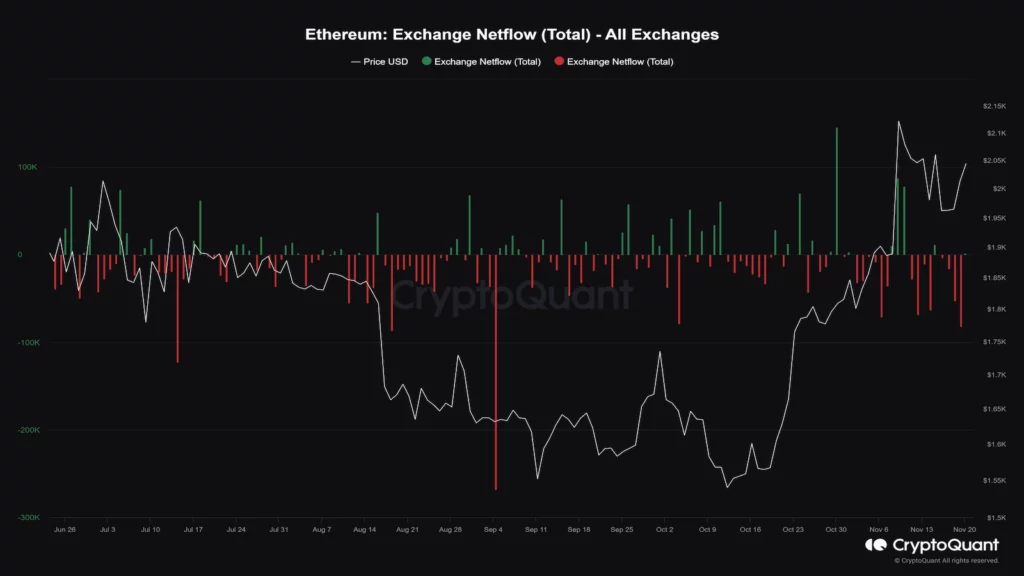
Data from CryptoQuant shows that Ethereum outflows have outpaced ETH inflows since Oct. 30, with a few exceptions. Moreover, the ETH exchange reserves dropped by over 311,760 ETH (nearly $636 million) between Oct. 30 and Nov. 20.
Increased exchange outflows often suggest a hodling mindset among investors. Ethereum whales are likely picking up on speculations of a spot ETH ETF, moving their ETH holdings to cold wallets to book profits later.
Ideally, hodling results in a decrease in circulating supply, which might become a bullish cue if demand spikes. Additionally, since retail traders often mimic whale movements, whale investors hodling could see retail investors pulling liquidity from the market.
Interestingly, Ethereum whales continue to buy the prime altcoin.
ETH Price Forms Bullish Pattern
Meanwhile, ETH price has formed a bullish technical pattern called the ‘Ascending Triangle.’
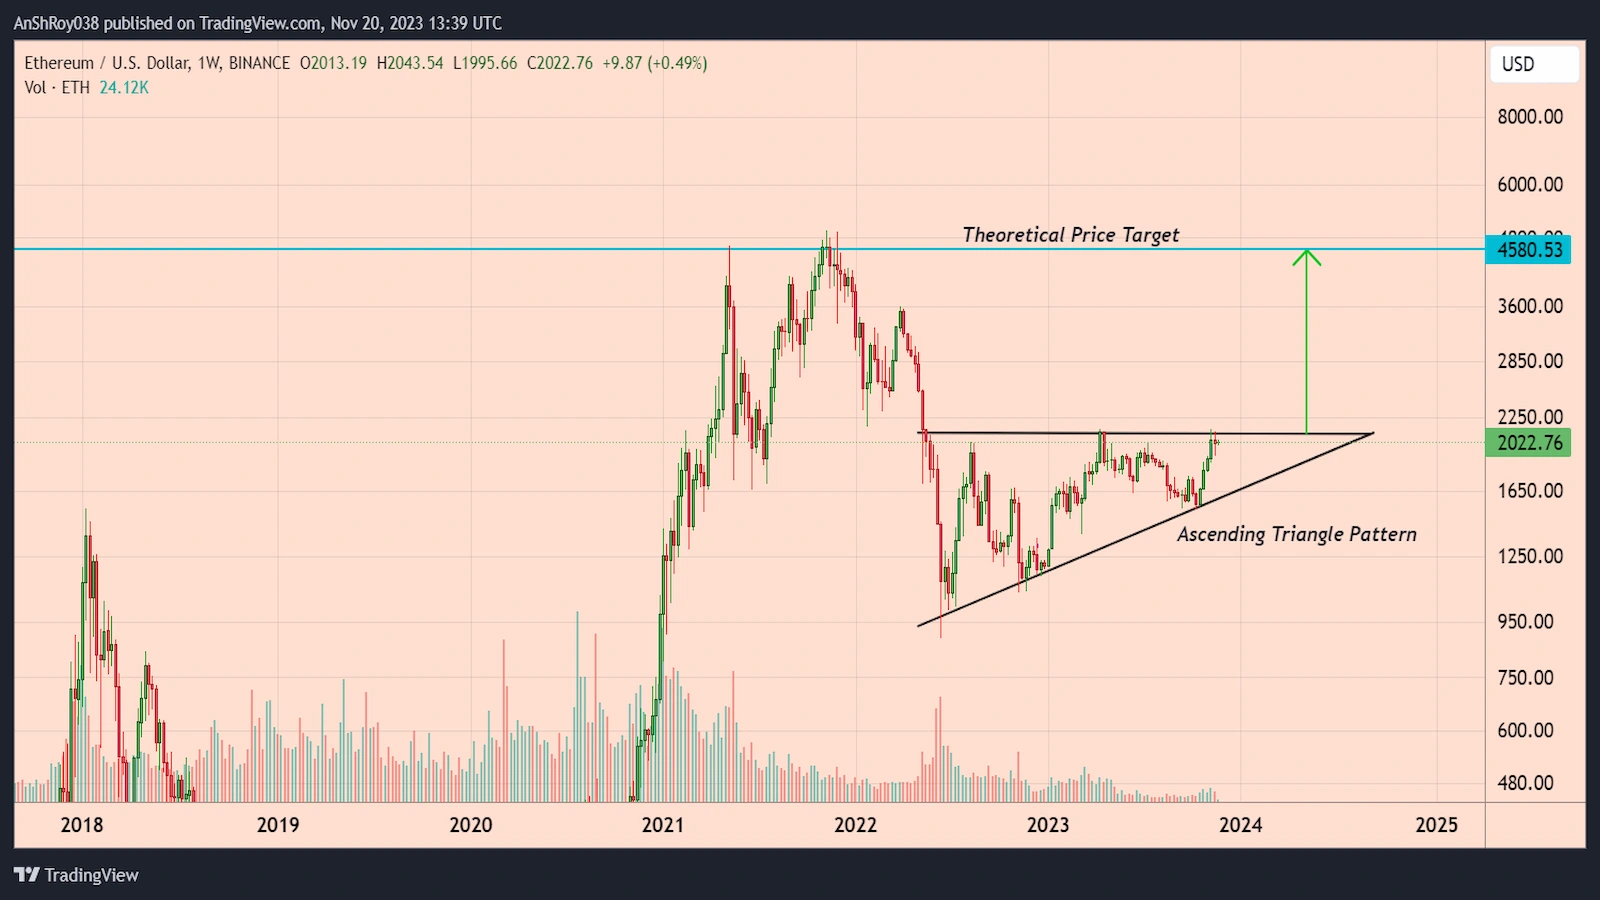
A horizontal trendline linking swing highs and an ascending trendline connecting swing lows create an ascending triangle pattern. Volume is crucial for confirming a strong breakout. Ideally, buyers enter as trendlines converge, driving prices above horizontal resistance with substantial volume.
However, a low-volume breakout often leads to failure and a subsequent pullback.
Per the rules of technical analysis, the price target for a breakout is equal to the triangle’s height at its thickest point. As such, ETH’s price could rally over 126% to reach the theoretical price target near $4,580 if the pattern pans out.
Ethereum Price Rebounds Off EMA Support
ETH bulls defended the 20-day EMA (the red wave) support near $1,940 after the 5% drop on Nov. 16, despite massive bearish pressure. The Ethereum crypto token’s price spiked nearly 3% on Nov. 20 to reach a daily high near $2,050 before bears pushed back prices.
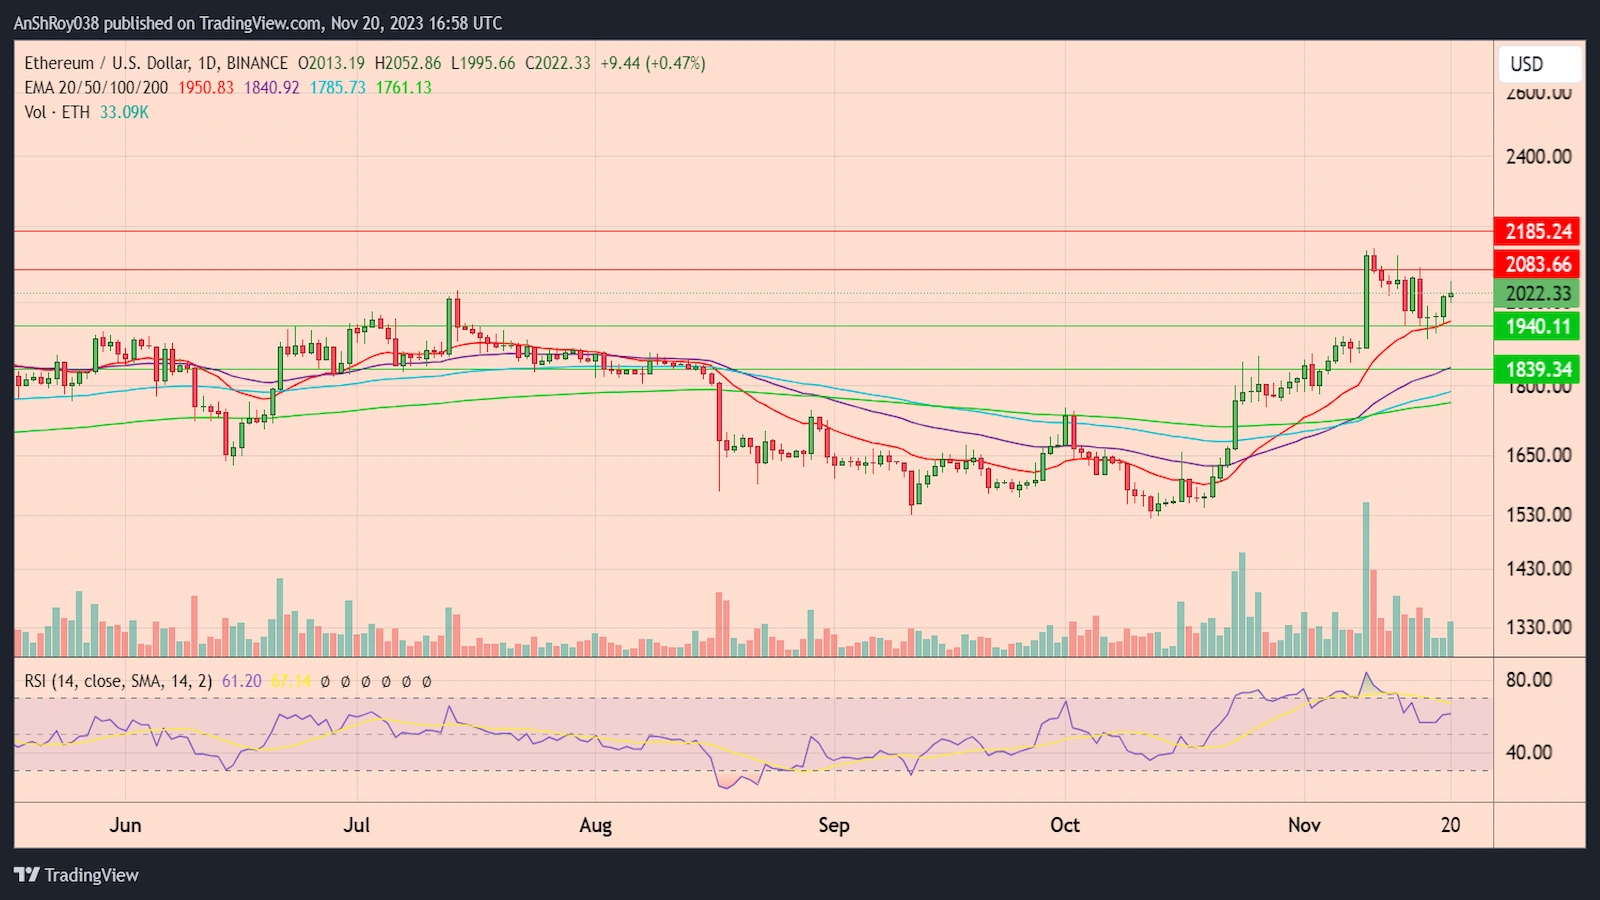
Despite Ethereum whale activity suggesting bullish investor sentiments, profit-booking by bears could force the ETH price to break below the immediate support and test the 50-day EMA (purple wave) support near $1,840.
Conversely, a spike in demand could help the ETH price rally to the resistance near $2,080. A breakout above the immediate resistance might help Ethereum price target the resistance near $2,190 before correcting.
The RSI for ETH remained neutral, with a reading of 61.2 on the daily charts.
The post Ethereum Whale Activity Indicates 100% ETH Price Rally appeared first on CoinChapter.


