

Key Takeaways:
- A Wall Street fractal returns to haunt stocks and Bitcoin.
- The fractal concerns 1987’s infamous Black Monday.
- BTC traders should watch US bond yields and Nasdaq-100 charts for more clues.
YEREVAN (CoinChapter.com) — Bitcoin (BTC) investors are typically more optimistic than realistic. They keep hoping for the best outcome on their short and long-term investments, even when faced with daunting market fundamentals.
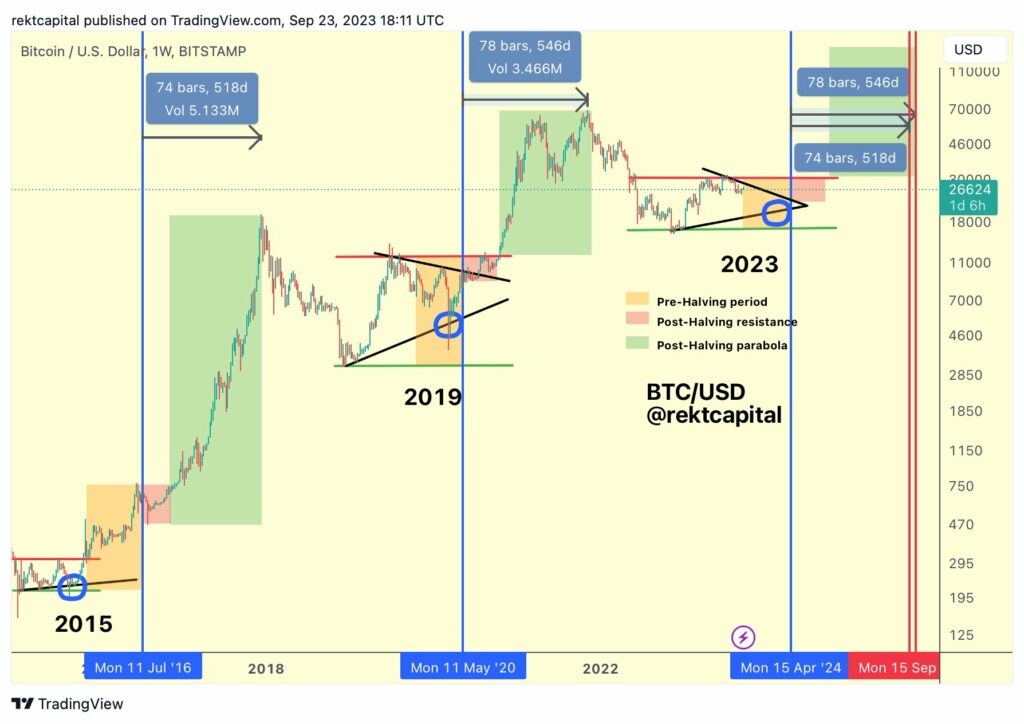
That explains why popular Bitcoin analysts have started predicting massive price rallies of “halving” in mid-2024, with some even forecasting BTC to hit $100,000. For instance, look at Rekt Capital’s viral fractal chart comparing Bitcoin’s ongoing price trend with the ones ahead of the previous halving in May 2020.
But, the question arises: Who will have money to buy Bitcoin and its potential Wall Street derivatives should a financial calamity occur out of turn? This article discusses the prospects of Bitcoin price crashing toward $16,000 in the coming months due to one such “plot twist.”
Part 1: The Troublesome Bitcoin-Bonds Positive Correlation
One of the strangest developments in 2023 has been Bitcoin’s resilience in the face of rising bond yields.
Notably, the BTC price has risen nearly 67% year-to-date (YTD) to around $27,575. In comparison, the yield on the benchmark 10-year US Treasury note has grown 25% YTD to reach its multi-year peak near 4.812%.
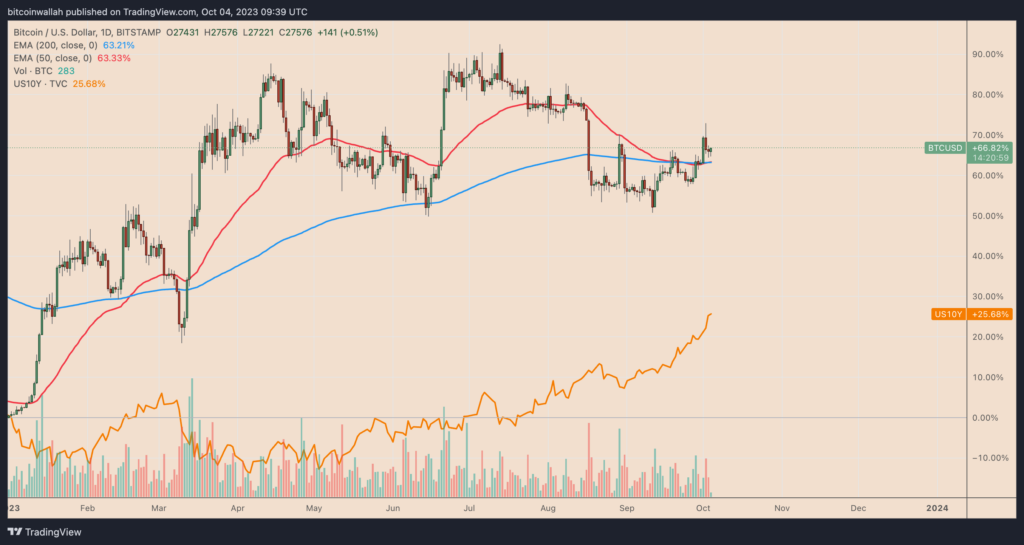
The positive correlation is fishy. Bitcoin behaves like a non-yielding, riskier asset, like stocks, despite being touted as safe-haven. Therefore, its demand should wane when the opportunity cost of holding US Treasuries improves due to rising yields.
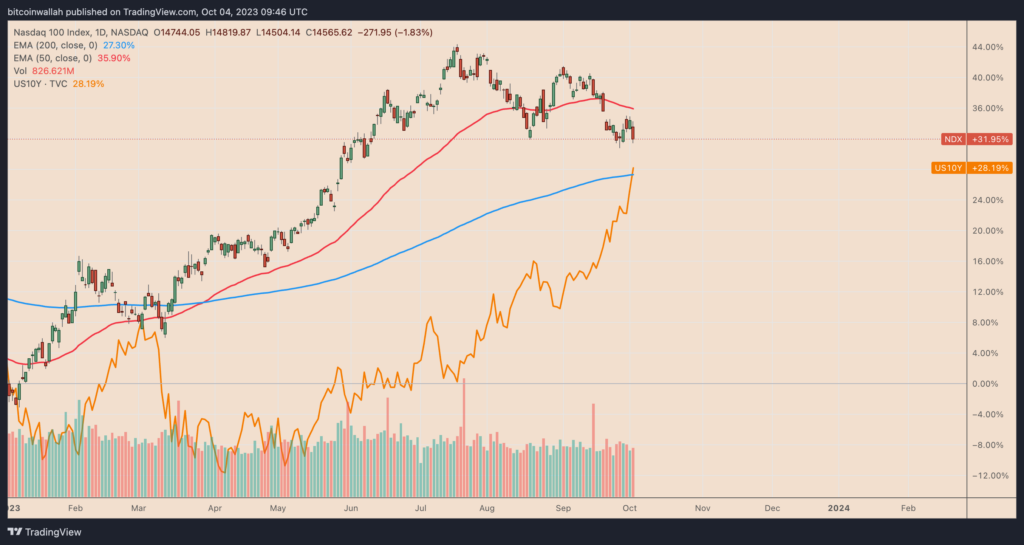
Nonetheless, Bitcoin, and even stocks, have jumped in 2023, as well, as shown via the Nasdaq 100’s upside performance below.
Part 2: The 1987 Black Monday Vibes
Popular Wall Street analysts see the ongoing concurrent rally in the US bond yields and equities as eerie, reminiscing the 1987’s notorious Black Monday crash. And we somehow raise Bitcoin’s risk status due to its poor performances during financial meltdowns.
Did you know? Black Monday refers to October 19, 1987, when global stock markets experienced a severe crash. On that day, the Dow Jones Industrial Average (DJIA) in the United States dropped by a staggering 22.6%. This event is considered one of the most significant financial crises in modern history.
But first, let’s compare the macro data points of 1987 and 2023, beginning with yield spikes.
Notably, the bond yield spikes in 2003 are similar to 1987, as illustrated with an overlay chart mentioned in Bloomberg’s newsletter.
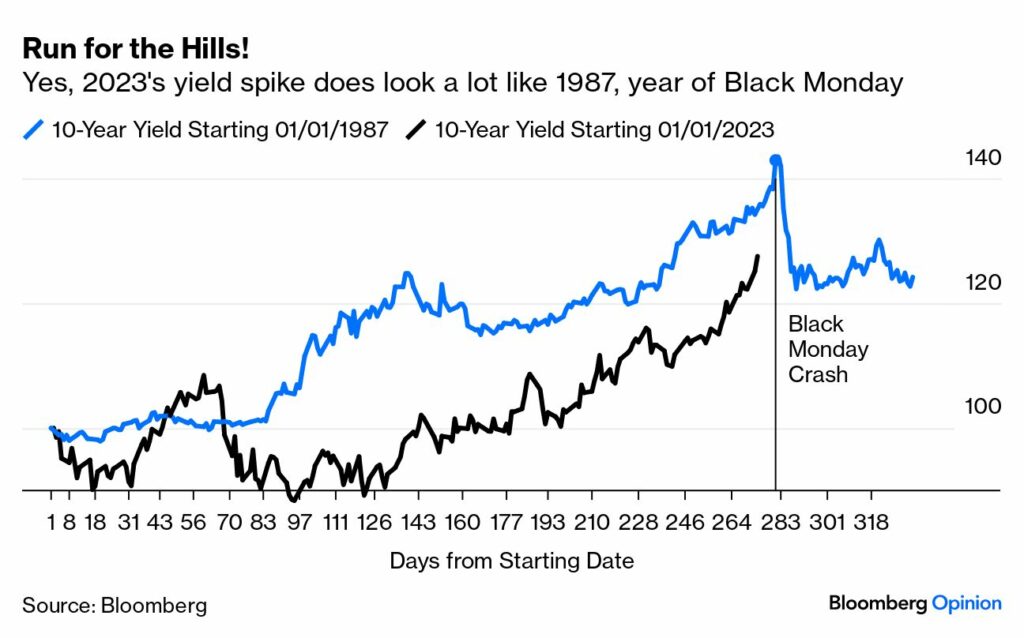
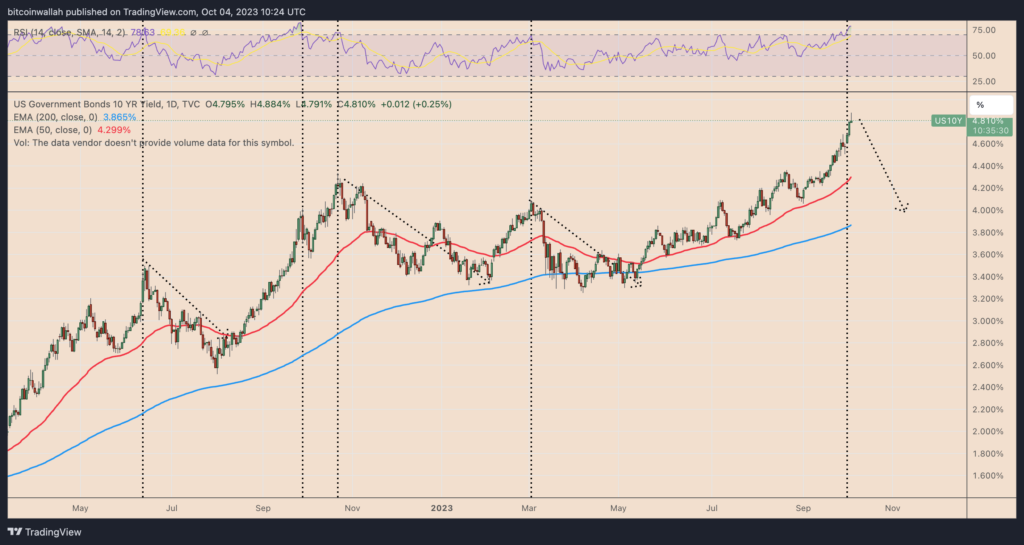
On Sep. 20, 2023, Federal Reserve Chairman Jerome Powell expressed his hawkishness after the Federal Open Market Committee meeting. The US 10-year yields spiked after the comments, which, as it appears, is similar to its “breakout day” on Aug. 27, 1987.
Chris Verrone of Strategas Research Partners estimates the yields topped on Oct. 15 at 10.23% — 33 trading days later. As of October 2023, the strategist said, “that would be the equivalent of roughly 5% on the 10-year by early November.”
Part 2.5: Dow Jones Was Rallying Before Black Monday (Like Nasdaq-100)
Plotting Nasdaq 100’s performance in 2023 against Dow Jones during the 1987 Black Monday crash reveals more eerie similarities.
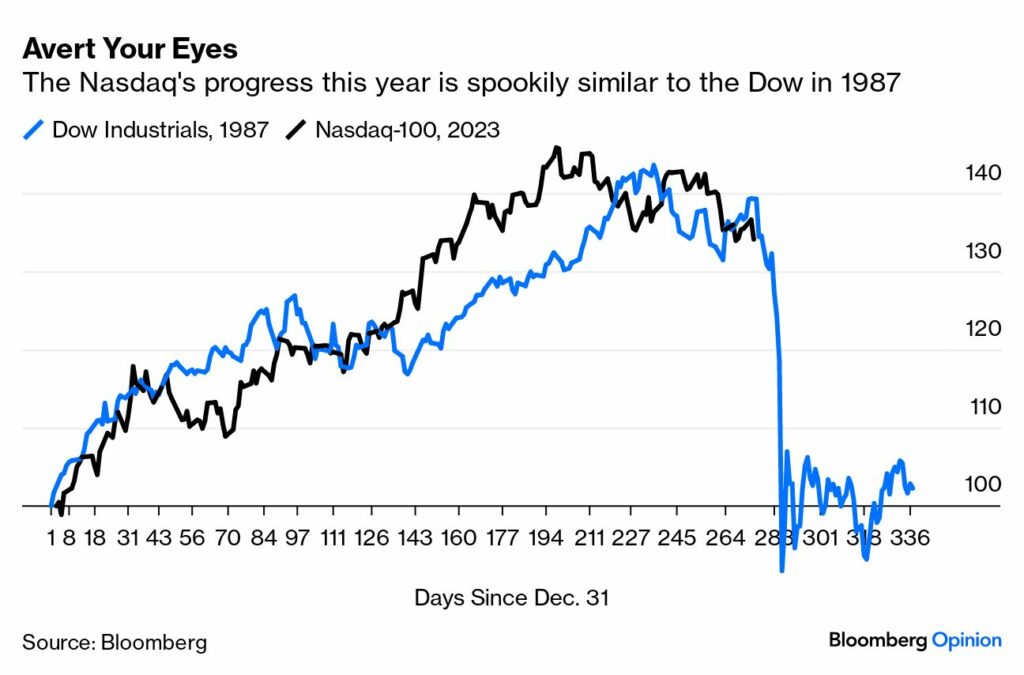
Simply put, the fractal says the stock market risks crashing if the yields reverse course from their current levels. To add the tension, they look overbought per their daily relative strength index (RSI) readings above 70, which has historically preceded sharp corrections.
Part 3: Bitcoin Price Meets 1987 Fractal
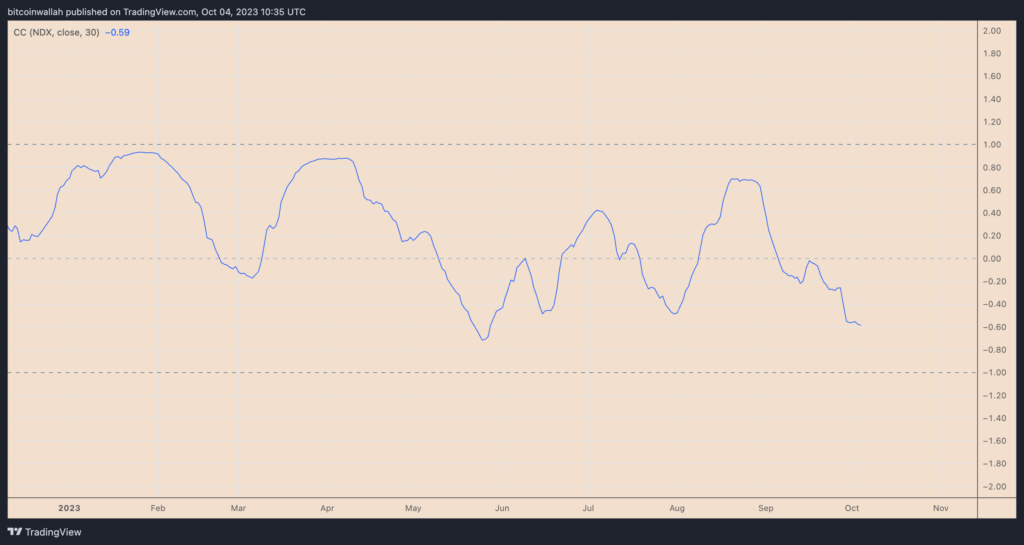
The 30-day correlation coefficient between Bitcoin and Nasdaq-100 is at its most negative since May 2023. In other words, for now, the cryptocurrency may rise if equities underperform.
However, the negative correlation, such as sharp yield reversals, may not stick during a Black Swan event. That is quite visible in how BTC’s price crashed in tandem with the stock market in March 2020 while the U.S. dollar rose.
So, as yields retreat from their overbought positions, they may prompt Nasdaq-100 and, in turn, Bitcoin lower. Therefore, the BTC price risks breaking below its 200-week exponential moving average (200-week EMA; the blue wave) support near $25,730.
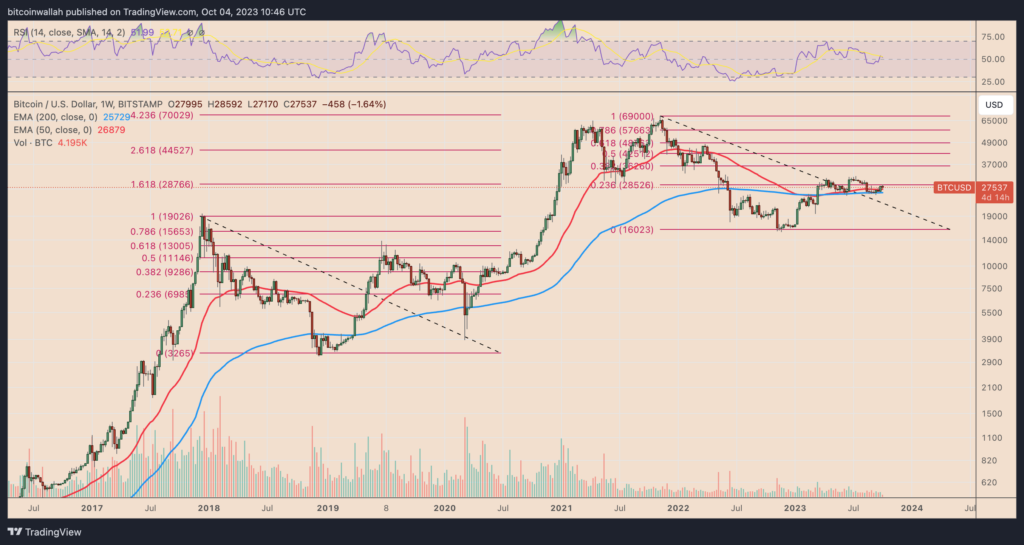
Suppose it happens. Then, the BTC price’s next downside target appears to be around its 0.0 Fib line near $16,000.
The post This Bitcoin ‘Plot Twist’ Risks Sending BTC Price Crashing to $16K in 2023 appeared first on CoinChapter.


