

Key Takeaways:
- Bitcoin price has formed a technical pattern, almost always bearish for the token.
- BTC price dropped below $26,000.
- Traders remained bullish on Bitcoin’s prospects.
NEW DELHI (CoinChapter.com) — Bitcoin (BTC) price has formed a bearish technical pattern that has historically predicted a downtrend for the token.
The ‘Death Cross‘ pattern occurs when a short-term EMA trendline crosses below a relatively long-term EMA. In the case of BTC, the death cross occurred between the Bitcoin price’s 12-week EMA and 21-week EMA trendlines.
Bitcoin Price’s History With 12/21 Weekly EMA Death Cross
Between 2014 and 2023, BTC price’s 12-week EMA (blue wave) and 21-week EMA (red wave) formed a death cross seven times (red and green lines in the chart above).
In 2014, Bitcoin formed the Death Cross in August, following which BTC price dropped over 69% over the next four months, reaching a low of $163.9 on Jan. 14, 2015. The next death cross between the weekly EMAs formed in August 2015.
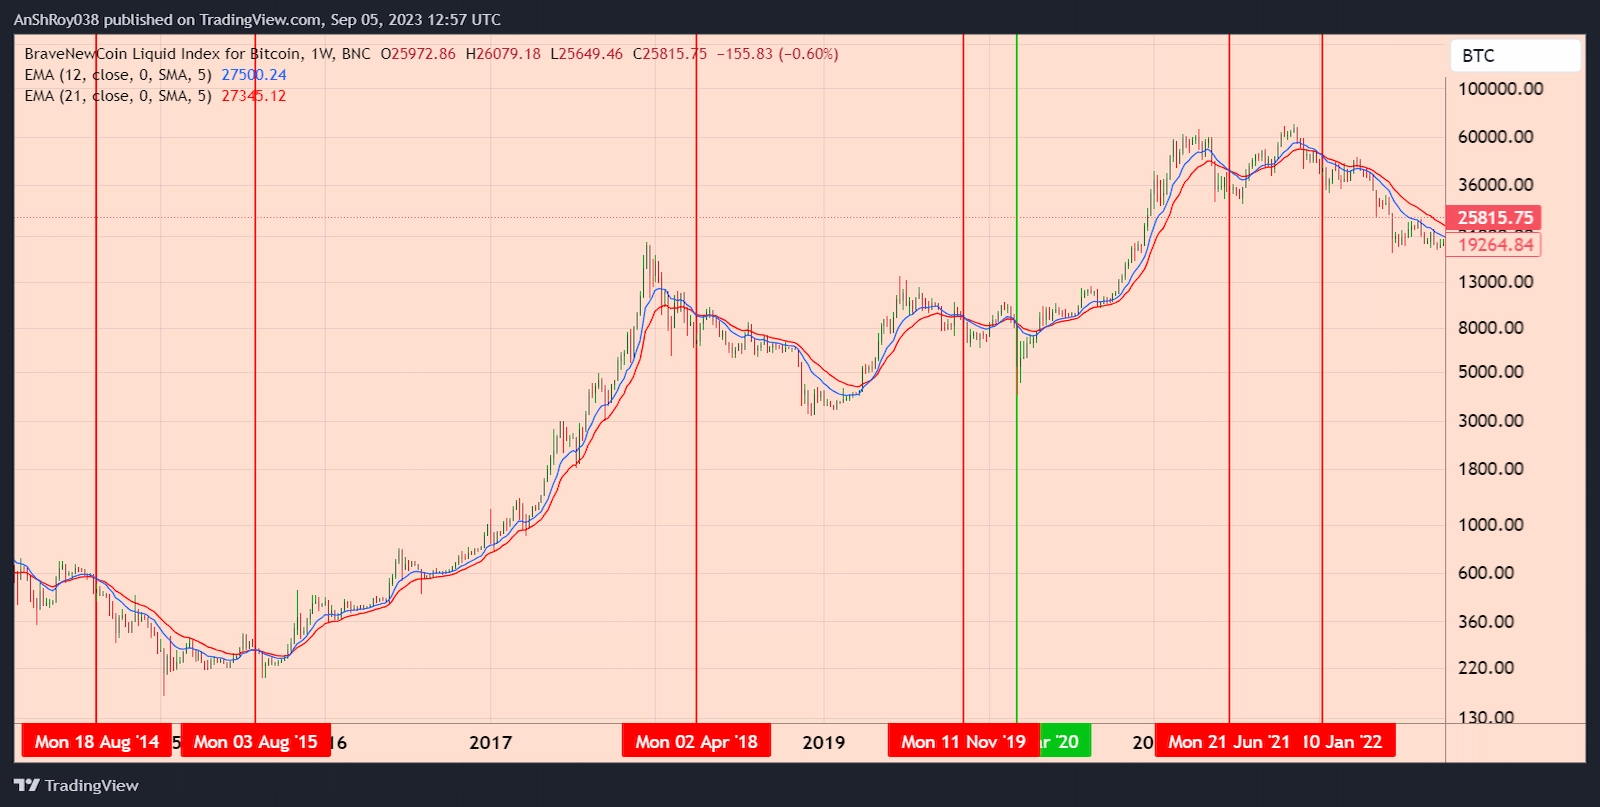
Following the pattern’s formation, Bitcoin’s price dropped over 29% between Aug. 8, 2015 and Aug. 25, 2015. The token then entered a period of consolidation before rallying to the token’s then ATH of $19,764.5.
In 2018, BTC prices dropped only 12.5% in three days after forming the Death Cross in April. However, the relief rally following the downtrend was short-lived, with BTC price painting lower highs till Dec 2018, dropping nearly 67% to a low of $3,248 in December 2019 before recovering.
In Nov 2019, the BTC price more or less consolidated after forming the pattern. However, the token’s price did drop by over 25% to a low of $6,535 on Nov. 25, two weeks after forming the bearish pattern.
The trend marginally broke its pattern with the Death Cross in March 2020. After forming the weekly EMA death cross on Mar. 12, 2020, BTC price dropped nearly 50% to a low of $3,941 in less than two days.
But the token started trending soon afterward. The other two times Bitcoin formed the Death Cross, in June 2021 and January 2022, the price action remained true to historical trends.
Traders Bullish On BTC Price Prospects
Meanwhile, Bitcoin traders remained divided on X (formerly Twitter) on the token’s prospects. Crypto trader XO told his more than 431,000 followers about Bitcoin price, forming the 12/21 weekly EMA death cross.
Another crypto technical analyst, CryptoCon, highlighted that Bitcoin price has launched a bull market every time the token’s weekly RSI has crossed above the “dashed mid-line.“
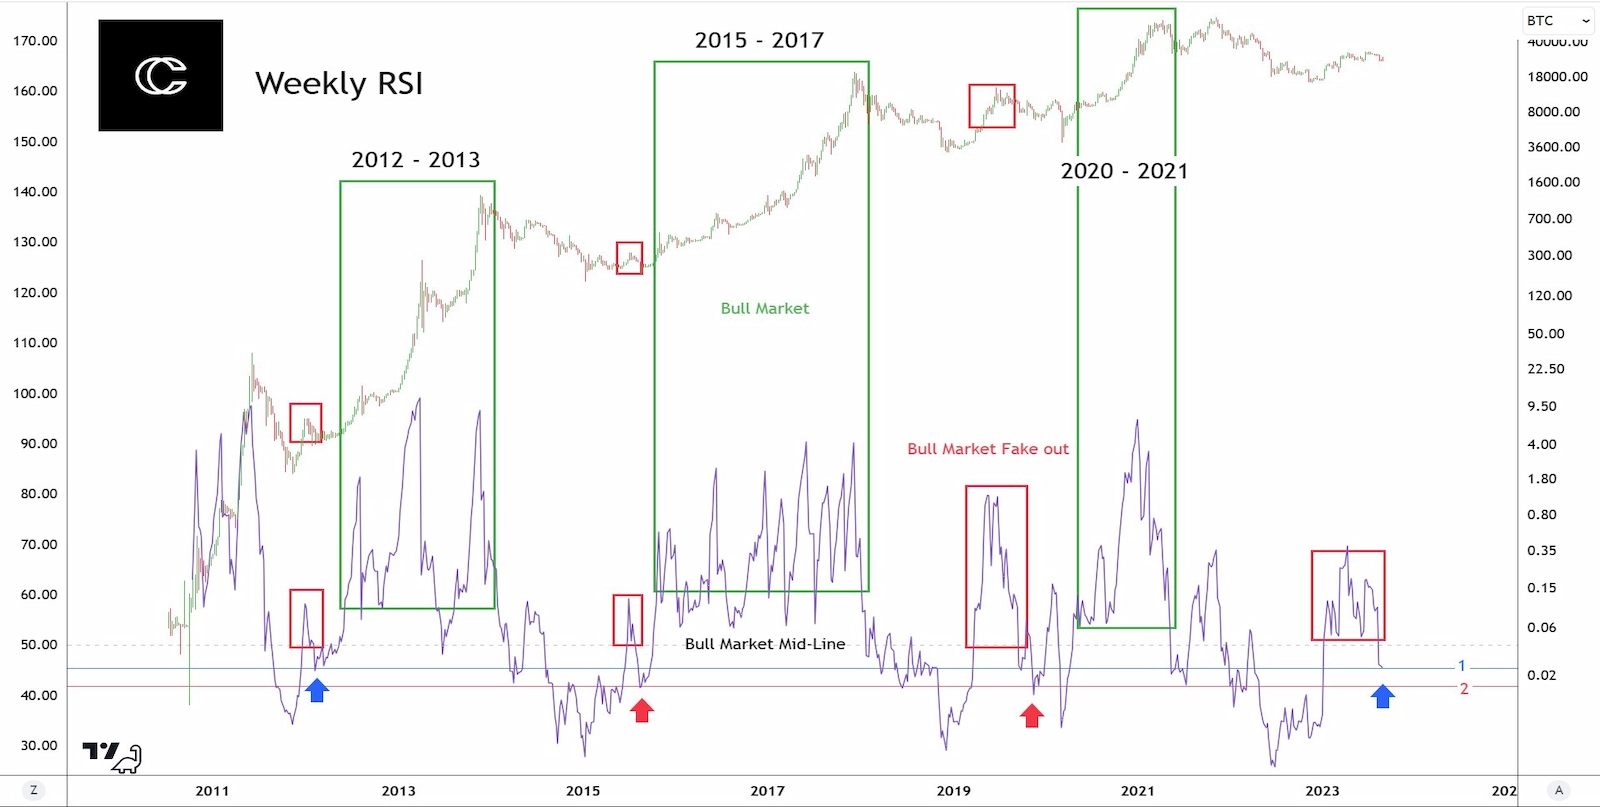
However, before the beginning of every bull cycle, BTC price painted a fake crossover, and CryptoCon speculated that the fakeout was complete.
After the rise to 32k, the fakeout is now completed. There are two major support levels marked (red and blue) which have been retested as support after every fake out.
CryptoCon told his 39,200 followers
Bitcoin trader and analyst Crypto Rover also shared a BTC price chart, speculating that the token was “on the verge of a gigantic breakout.“
However, not everyone remained convinced of Bitcoin’s bullish prospects.
BTC Price Fails To Break Above $26,000
Bitcoin price failed to cross above the $26,000 price level after dropping below the level on Aug. 31. BTC price has been crabbing in September, testing the support of the ascending parallel channel.
On Sept. 5, the prime crypto token’s price dropped nearly 1.1% to a daily low near $25,547 before recovering. Bulls have been buying the dips in BTC prices, judging by the long upper wicks on the token’s daily candles.
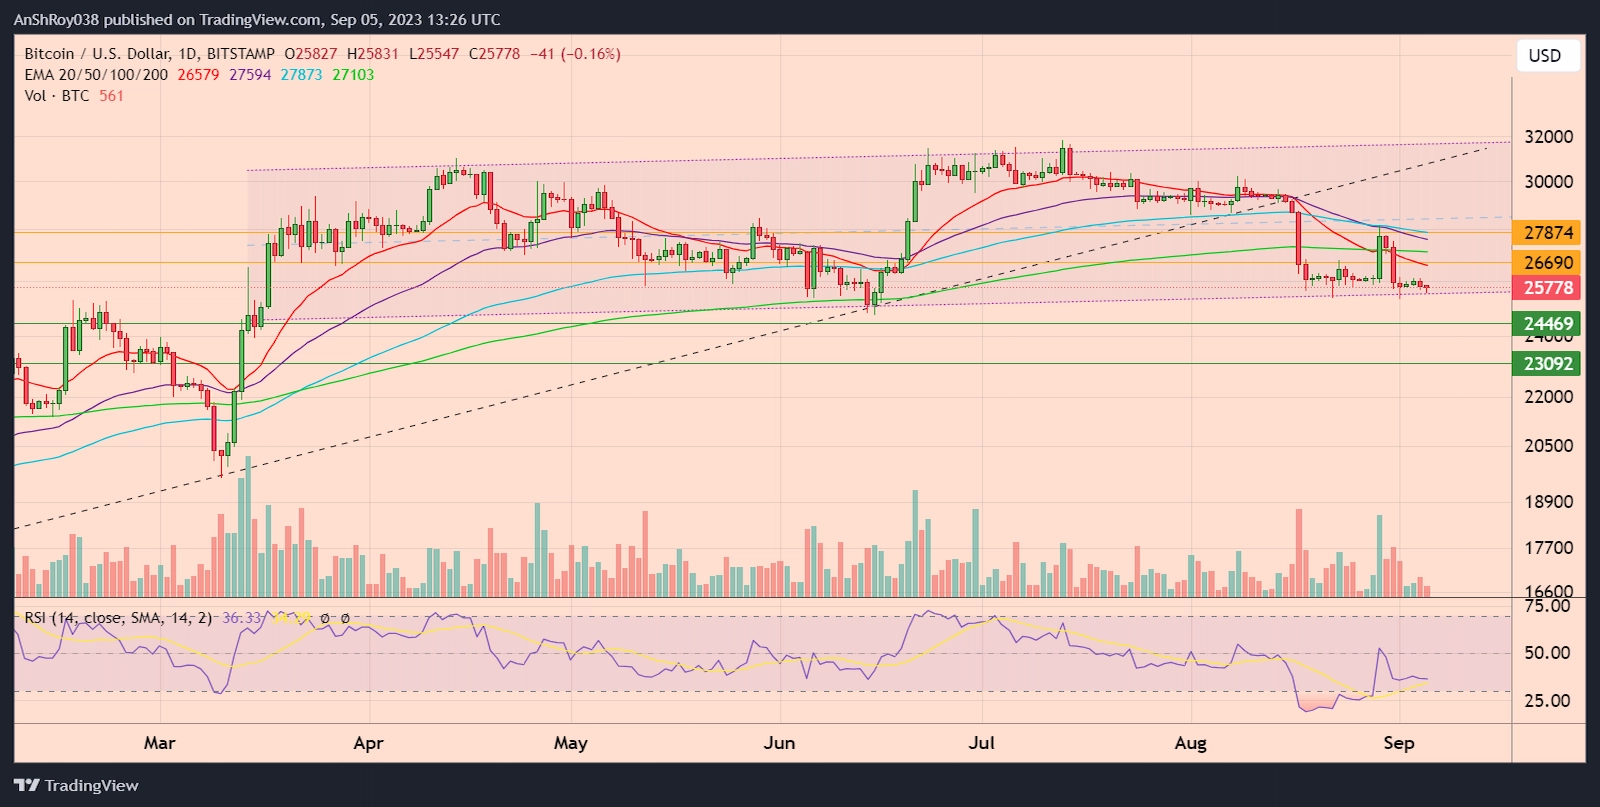
If the BTC price breaks below the ascending channel’s support, the BTC price might drop to the support near $24,470. Moreover, breaching the immediate support level could force Bitcoin price to test the support near $23,000 before recovering.
Conversely, the BTC price would need to conquer the 20-day EMA (red wave) resistance near $26,700 before targeting the 100-day EMA (blue wave) resistance near $27,870.
The RSI for BTC remained neutral, scoring 36.33 on the daily charts.
The post Warning! Bitcoin Technical Pattern Preceding Major Price Declines Returns as BTC Hangs Near $25K appeared first on CoinChapter.


