

LTC, XTZ and DOGE have all experienced a correction in the last 24 hours.
Litecoin, Tezos and Dogecoin are under some downward pressure, correcting recent gains amid a slowdown in Bitcoin and Ethereum. The first two coins experienced difficulties after correcting crucial price levels above $ 50,000 and $ 3,300 respectively.
Volatility over the weekend could see corners heading higher, although the near-term outlook for LTC, XTZ and DOGE suggests prices could test previous support areas before rebounding.
Litecoin price analysis
Litecoin’s price broke below an upward support line on the daily chart, with the LTC / USD pair falling into a critical support area below $170. Bulls are currently looking for a rebound above the Fibonacci retracement level of 0.236 from the $104 to $ 192 move. The line, currently located near $ 171, provides a supply area that could see LTC prices correct downwards.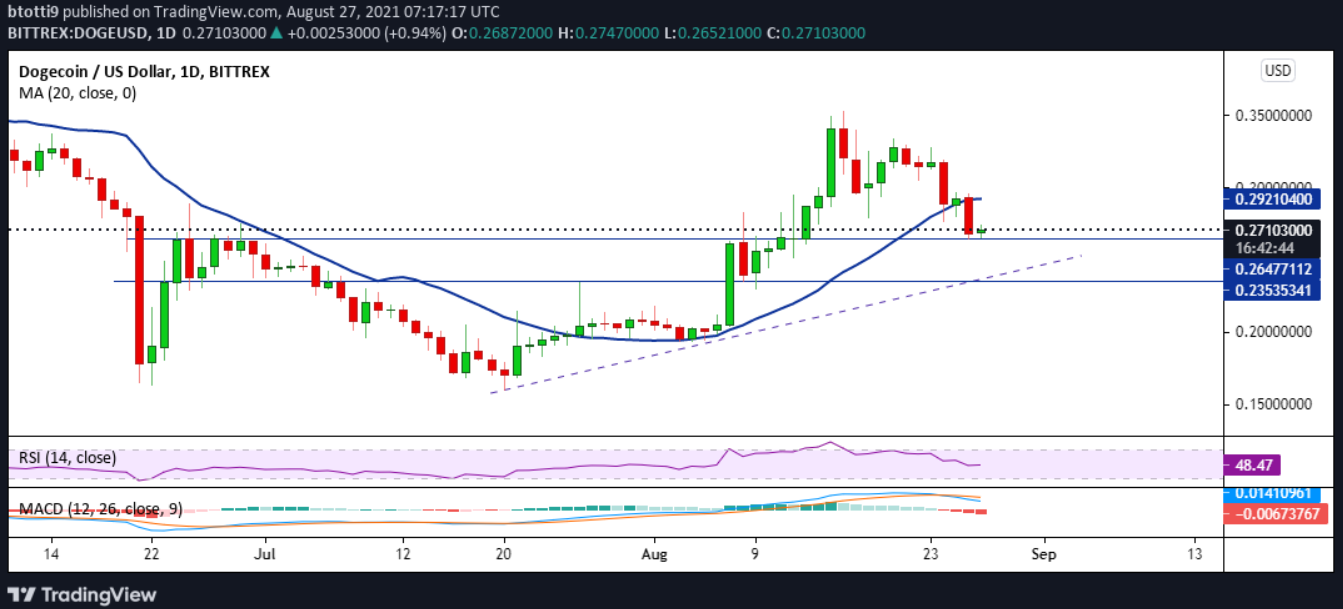
Daily LTC/USD chart. Source : TradingView
The negative outlook for LTC is reinforced by a falling RSI and a bearish MACD, suggesting a potential recovery in the Fib 0.5 level ($148) and the 50-day SMA ($149). The next support area is at Fib level 0.786 ($123).
Tezos price analysis
The price of XTZ gained 28% on Wednesday after learning that leading Swiss banks had called on Tezos for smart contract projects. The value of the coin hit a 7-day high of $5.44 on Coinbase before suffering massive profit-taking the following day and falling below $ 4.35.
On the downside, XTZ’s price could retest the key support area at $ 4.17, marked by the 0.618 Fib level of the move from $ 2.10 to $5.44. The $ 3.87 20-day EMA line offers the next anchor, with the Fib 0.5 level also providing a potential demand area at $3.77.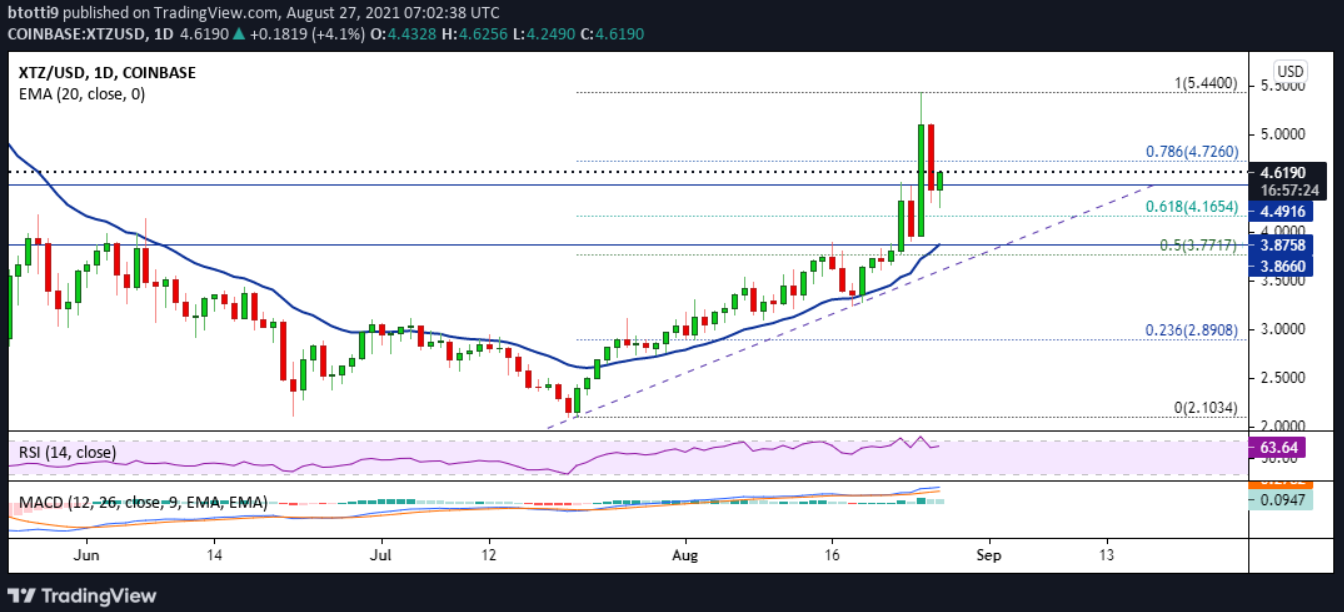
Daily chart of XTZ / USD. Source : TradingView
On the upside, the RSI above 60 and a bullish MACD suggest the price could consolidate above $4.50. If the bulls keep prices above the uptrend line on the daily chart, the legitimate targets are around $ 4.73, $ 5.11 and $5.44.
Dogecoin price analysis
The price of Dogecoin has traded lower since breaking the highs of $ 0.35 on August 16. DOGE’s price retested the $ 0.26 support area, which is currently the anchor point in the event of a further decline.
Daily chart of DOGE/USD. Source : TradingView
The daily chart shows a decline in the RSI below 50, while the MACD has formed a bearish crossover and is heading towards the negative zone. The outlook suggests that DOGE could dip below the $ 0.26 area, with bulls likely to bounce back on the upward trend line with support near$0.24.
On the upside, the main resistance of DOGE / USD is at the level of the 20 EMA ($0.29).


