

Ether’s price is down 4% and could suffer further losses ahead of its highly anticipated London hard fork.
Ethereum is trading around $ 2,484 on major exchanges, with a negative 24-hour price change of 4% from its 30-day high of $ 2,672.76, according to CoinGecko data. It should be noted that ETH even tested a resistance close to $ 2,700 on some exchanges, reaching $ 2,699 on Bitstamp.
Ethereum, like Bitcoin, is facing downward pressure as bears seek to sell at higher levels, forcing bulls to defend gains around $ 2,450 and $ 38,400 respectively. Losses in the market led to a 3% drop in the capitalization of the global Crypto market, which currently stands at $ 1,620 billion.
ETH / USD is expected to continue to fall due to a spike in social discussions that, under the analysis platform Santiment, could signal a potential reversal in prices. In anticipation of Ethereum’s EIP 1559, technical analyst Michaël van de Poppe think that breaking below $ 2540 opens ETH/USD to a possible drop towards lows of $2180.
ETH / USD
The technical outlook on the 4-hour chart suggests that bears pose a threat, with the likely scenario that ETH revisits lower support levels before the London hard fork.
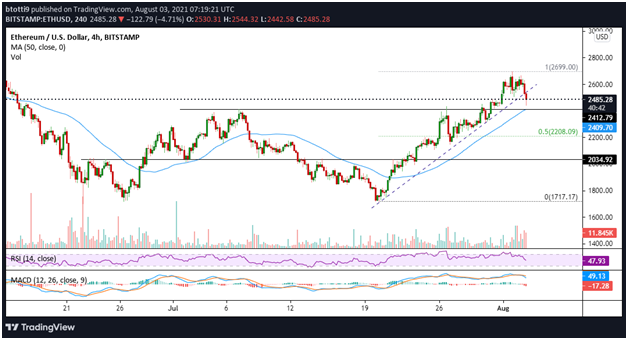
Chart of ETH/USD over 4 hours. Source : TradingView
As can be seen from the chart above, Ethereum broke below a trend line and dropped to lows of $2,443. Although the rise has returned above $ 2,480, bulls must look to make further gains if they are to defend the 50 moving average ($2,410) and avoid giving ground to the bears.
Looking at the technical image, we see that the RSI over 4 hours is below the 50 mark and it is plunging. Another technical indicator, the MACD, has formed a bearish crossover and is likely to rise in the negative area.
The outlook gives the bears the upper hand in the short term and if ETH / USD dips below 50 MA, the next support area would be around $2,350. If the bulls fail to hold above this level, sellers will target $ 2,208, which is the Fibonacci 50% retracement level of the $ 1,717 to $2,699 movement.
If the price drops from here, the main support will be the psychological line of $2,000.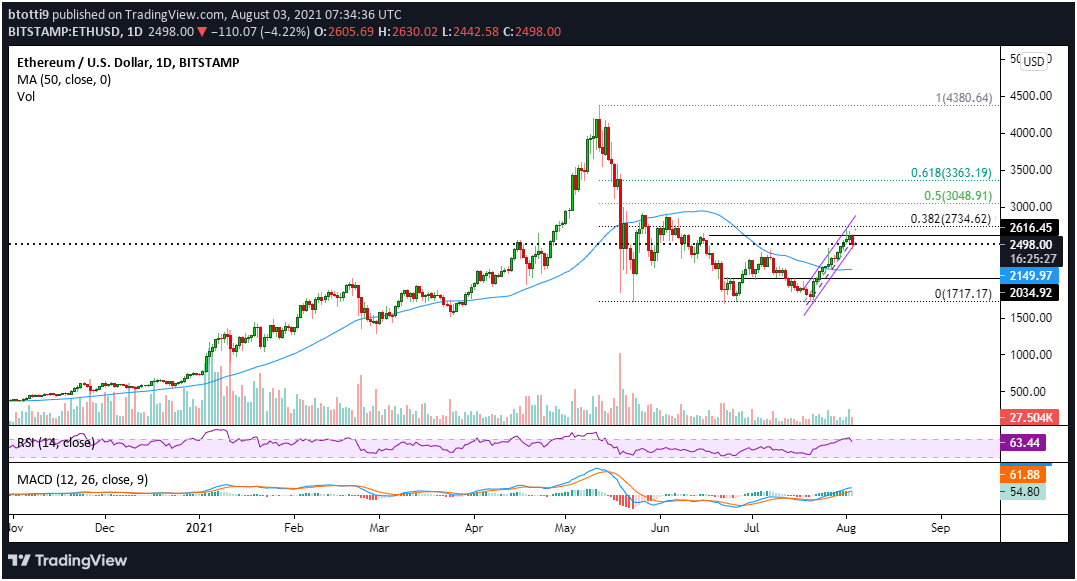
Daily chart of ETH/USD. Source :TradingView
On the daily chart, the price of Ethereum remains in an ascending parallel channel. However, the daily candle shows just how much pressure bullies have been under over the past 24 hours. In addition, the RSI is above the 60 mark, suggesting that the bulls are keeping control. The daily MACD is also in the bullish zone, indicating that the ETH/USD pair may experience another short-term rally.
If the price manages to break above $ 2,500, a rise towards the $ 2,600 resistance line would allow bulls to aim for the 38.2% Fib level ($2,735) and the 50% Fib level ($3,049).


