

Key Takeaways:
- Ethereum plummeted with the wider market following the FOMC meeting announcement.
- ETH price is moving inside a bearish pattern.
PATNA (CoinChapter.com) — Ethereum (ETH) price dropped over 5% on June 14 after the Federal Reserve announced it would not hike its benchmark lending rate. The Fed’s decision resulted in the ending of an 18-month streak of rate hikes in an effort to curb inflation.
Federal Reserve Jerome Powell observed that the inflation had moderated slightly since mid-2022. Ideally, the crypto markets should have reacted positively to the news. However, the sector witnessed a bloodbath, with Bitcoin’s (BTC) price dropping below $25,000.
Ethereum prices suffered, too, dropping 4.5% within hours of Powell’s press conference. Analysts speculate the downtrend was likely sparked by the FOMC hinting at the possibility of two more rate hikes in upcoming policies.
Also Read: BNB Price Completes Short-Term Correction and At Risk of Drop To $200
As a result, the total crypto market cap dropped by over 4% in the past 24 hours. The drop in BTC prices led to the liquidation of $100 million of longs in the market.
Shubham Hudda, Senior Manager at CoinSwitch Markets Desk, told Mint that markets might bleed more “if there is no immediate recovery across crypto assets.”
ETH Price Moving Inside A Bearish Pattern
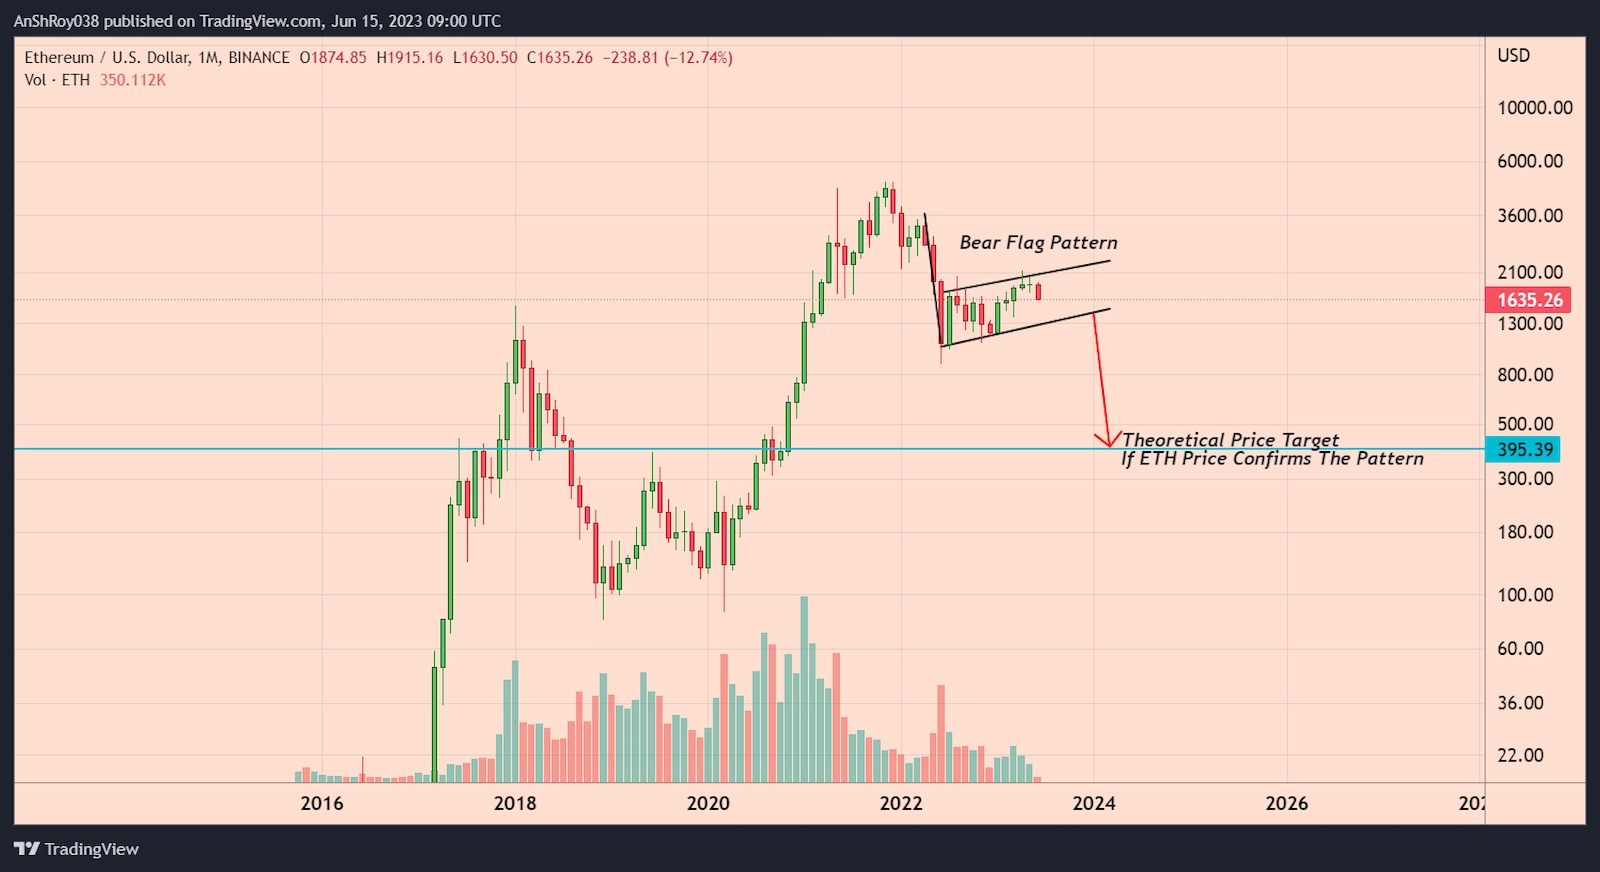
Meanwhile, the ETH price has formed a bearish technical pattern called the “Bear Flag.“
The pattern forms when a cryptocurrency’s prices chart a sharp countertrend (the flag) after a short-lived trend. Flag patterns usually indicate a reversal of the countertrend. In addition, in a bearish pattern, volume might not always decline during consolidation.
Since an uptrend marks the consolidation period after a sharp downtrend, investors enter the market hoping that the downtrend has ended. Hence, higher-than-average volumes often accompany the consolidation period.
Traders calculate the bear flag pattern’s price target by subtracting the flagpole’s length from the breakout price level. Hence, per the rules of technical analysis, ETH price could drop nearly 76% from its current levels to reach $395 before recovering.
ETH Price Drops For The Fourth Consecutive Day
ETH price continued its downtrend for the fourth consecutive day on June 15. The Ethereum token price dropped over 7% from June 12’s high of $1,758. FUD from the SEC lawsuits against Binance and Coinbase also added bearish headwinds against ETH price action.
Moreover, the prime altcoin’s recent price action has resulted in its 20-day EMA (red wave) crossing below the token’s 100-day EMA (blue wave) to form a bearish pattern called the death cross. Traders consider the occurrence an indicator of negative market sentiment and a sell signal.
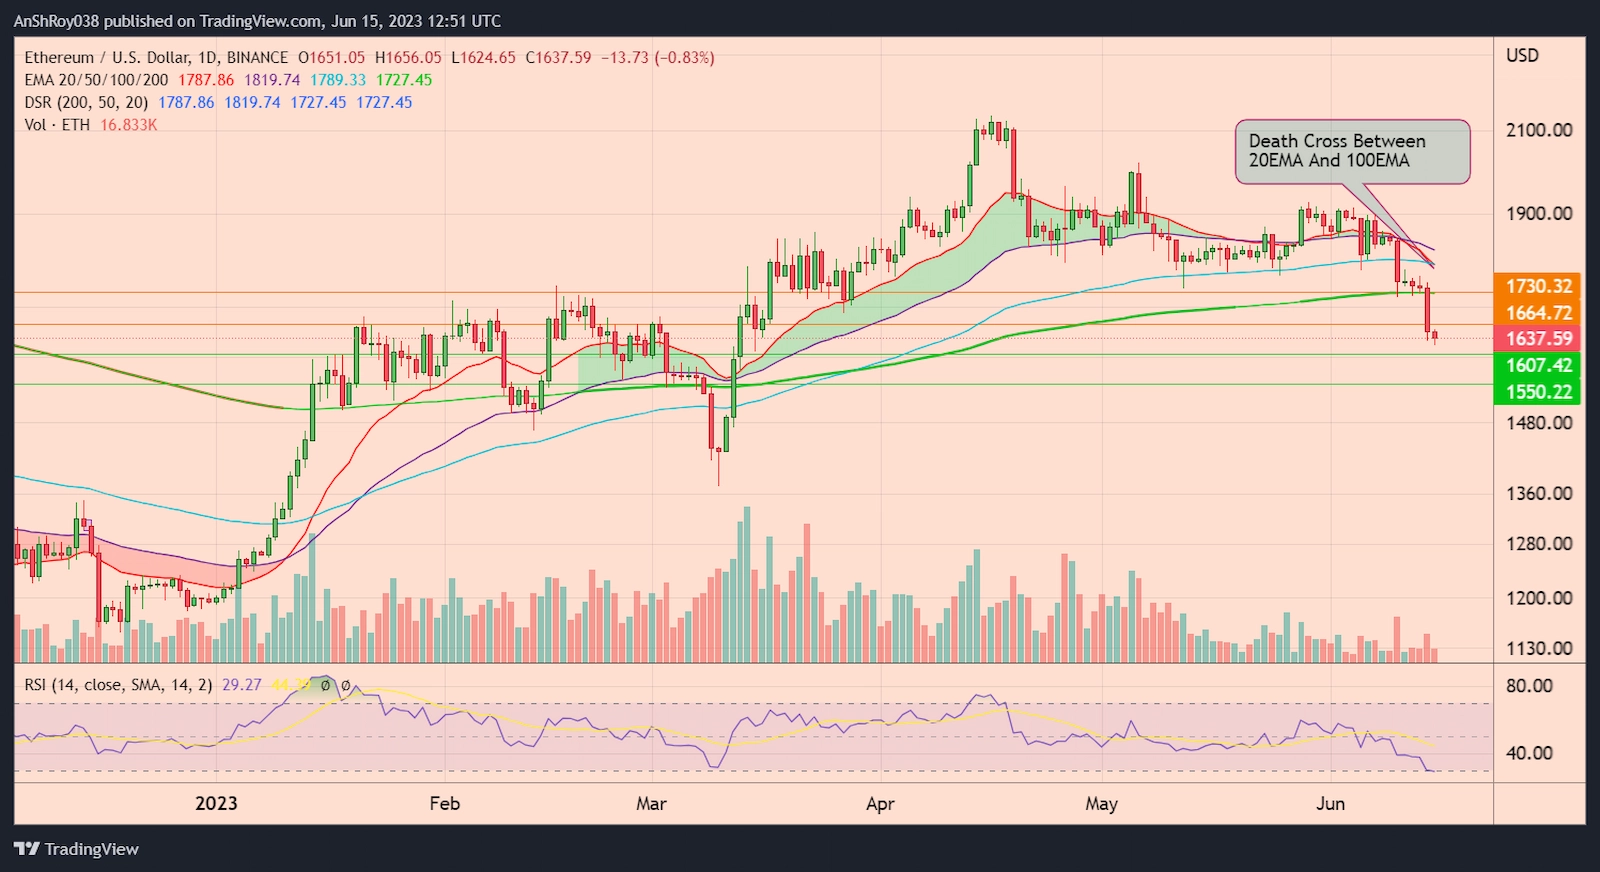
Hence, it seems likely that ETH would continue moving downward and test the support near $1,600. Moreover, breaching the immediate support level could force Ether price to drop to support near $1,550 before recovering.
The RSI for ETH became oversold on June 15, clocking at 29.27 on the daily charts. Moreover, technical indicators forecast a sell signal for the prime altcoin in the weekly and monthly time frames.
Conversely, a relief rally would likely face resistance near $1,660. However, breaking and holding above the immediate resistance could help ETH price target the 200-day EMA (green wave) resistance near $1,730 before corrections pare gains.
The post Why ETH Price Is Down Today? appeared first on CoinChapter.


