

Key Takeaways:
- Ethereum is declining heavily below the 0.060 support versus Bitcoin.
- ETH/BTC is following a major bearish trend line with resistance at 0.0598 on the weekly chart.
- The price could continue to move down toward the 0.04915 support or even 0.0.405.
NEW DELHI (CoinChapter.com) — Ethereum is gaining bearish momentum below 0.060 versus Bitcoin. The current price action suggests another 10% drop to 0.04915.
Ethereum Price (ETH) Struggles Vs Bitcoin
In the past few weeks, Ethereum declined from well above 0.075 vs Bitcoin. ETH/BTC followed a bearish pattern and traded below the 0.070 support zone.
The bulls took a stand near the 0.060 support zone, but they failed to protect more losses. Recently, there was a crucial downside break below the 0.060 support zone. The price is also following a major bearish trend line with resistance at 0.0598 on the weekly chart.
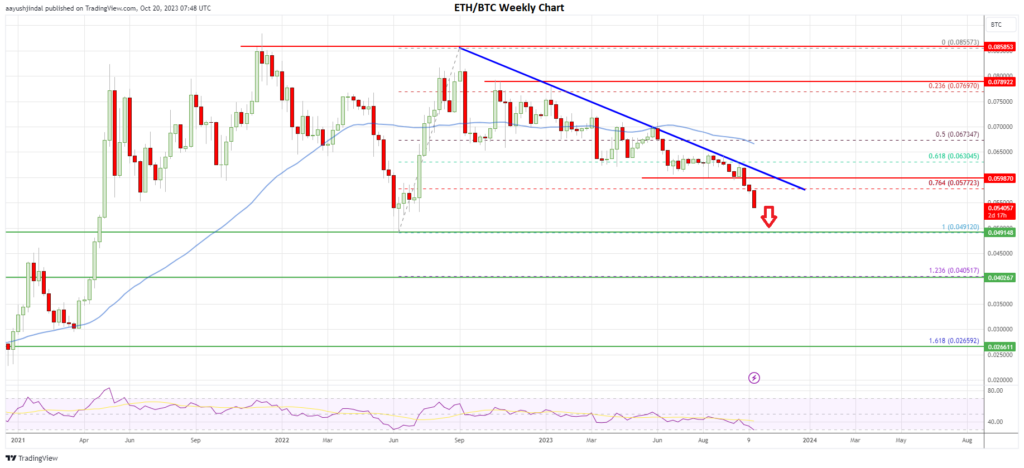
There was a close below the 76.4% Fib retracement level of the last major increase from the 0.0491 swing low to the 0.0855 high.
Ethereum is signaling a strong bearish sign below the 50-week simple moving average (blue) with three back-to-back bearish weekly candles. More importantly, Ether struggled to clear the $1,650 and $1,660 resistance levels, while Bitcoin climbed above $28,500, putting pressure on ETH/BTC.
It seems like ETH/BTC might continue to move down toward the last swing low at 0.0491. If the bulls fail to protect the 0.0491 support zone, there could be more downsides.
The next key support is near the 1.236 Fib extension level of the last major increase from the 0.0491 swing low to the 0.0855 high at 0.0405. Any more losses could send Ethereum toward 0.030.
Upsides Capped in ETH/BTC?
If there is a recovery wave, ETH could face resistance near the 0.0575 level. The first major resistance is near the trend line at 0.060. A close above the 0.060 resistance may perhaps start a fresh rally. In the stated case, the price may perhaps rise toward the 0.065 resistance.
The main downtrend resistance is near the 50-week simple moving average (blue) at 0.0675. A weekly close above the 0.0650 and 0.0675 levels could set the pace for a steady uptrend toward 0.085 or even 0.10.
Overall, Ethereum is signaling a bearish breakdown below 0.060 versus Bitcoin. ETH/BTC is now at risk of more downsides toward the 0.0491 level. Conversely, the ETH price might attempt a fresh recovery wave if there is a clear move above the 0.060 resistance in the coming weeks.
The post Why Ethereum Could Bleed ‘Like Hell’ Versus Bitcoin appeared first on CoinChapter.


