

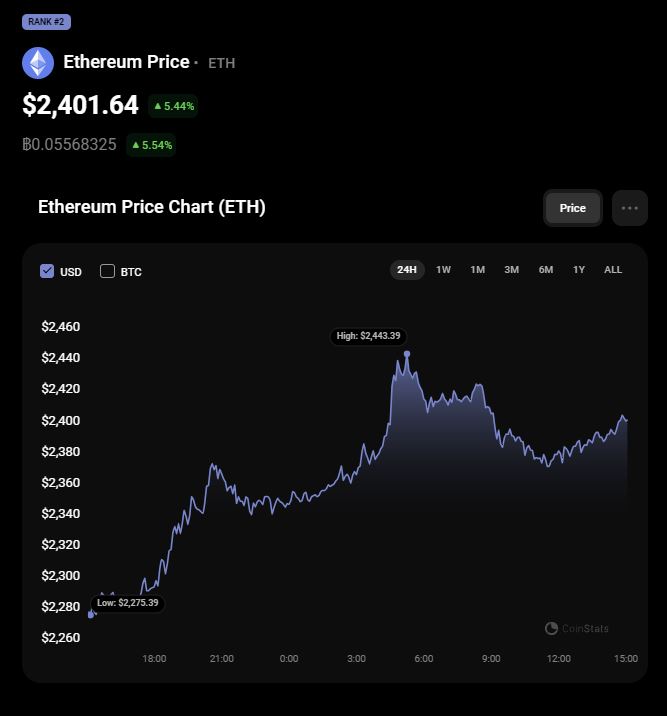
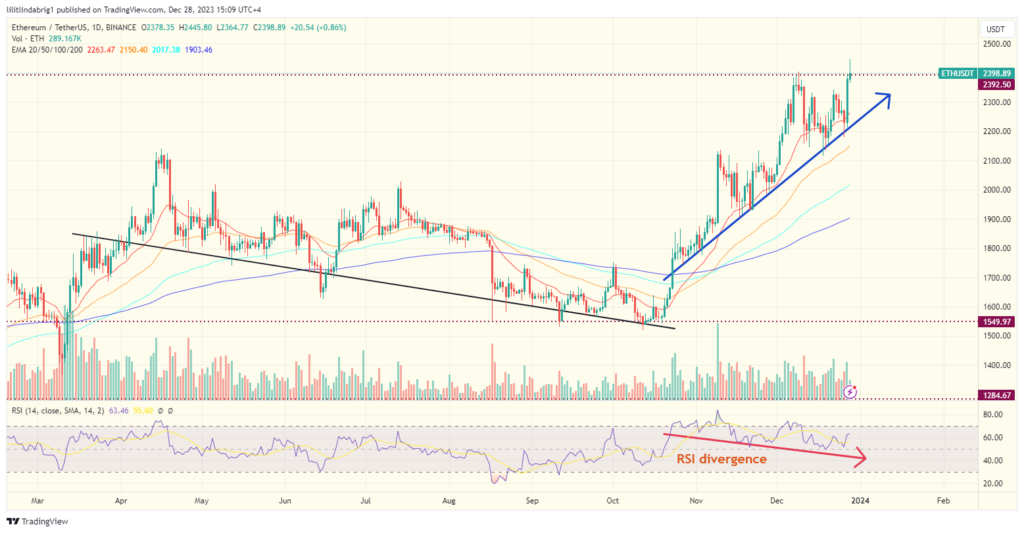
YEREVAN (CoinChapter.com) — Ethereum price is up today, with its native token, Ether (ETH), refreshing its 2023 high at $2,445, albeit now trading at around $2,400. Let’s examine the main factors behind the uptrend and the possible price targets.
Why is Ethereum Price Up Today?
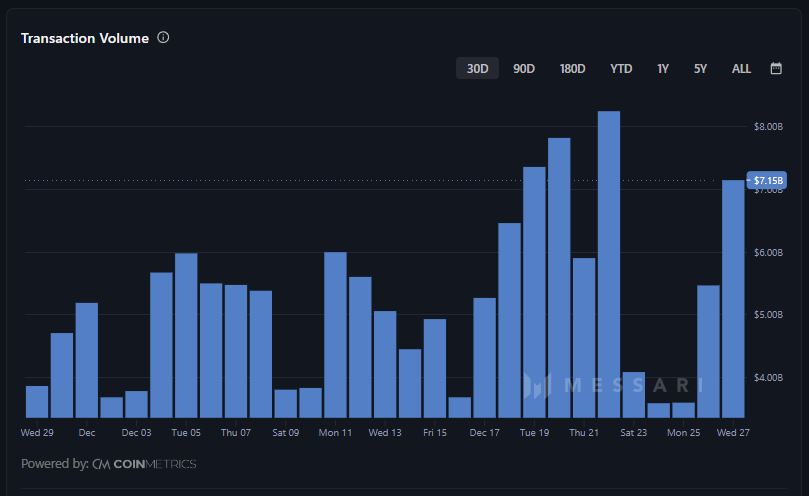
According to CoinMarketCap, Ethereum’s trading volumes flew up over 88% to $18 billion in the previous 24 hours, making a fresh monthly high. While the trading volumes alone don’t indicate whether ETH holders bought or sold, they point to a buying spree paired with the rising price action.
Other on-chain metrics agree. For example, the number of ETH whales, i.e., wallets holding large tokens, also grew to a three-month high. While the count of wallets holding over $10 million ETH stood at 2,000, the over-$1 million holders filled their ranks to 12,700.
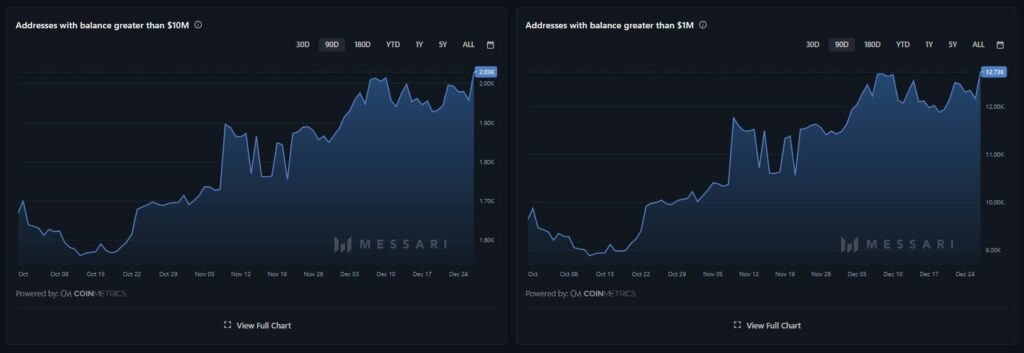
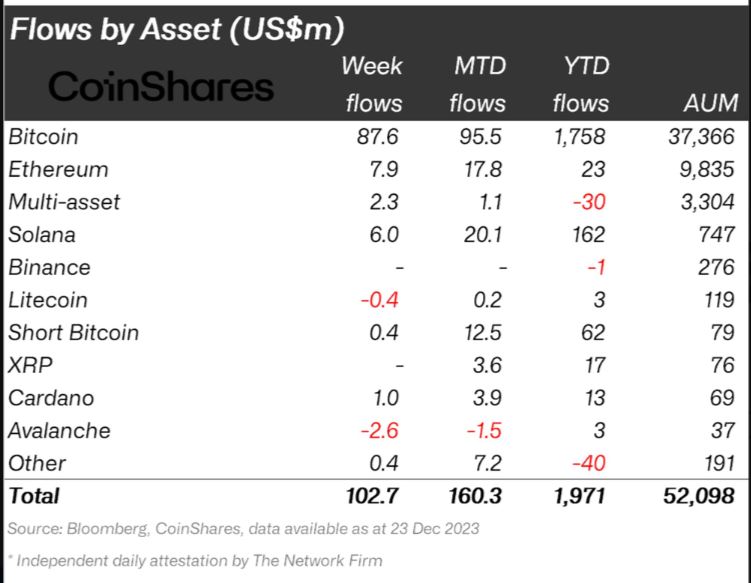
Whale behavior typically affects the market price and smaller players, as they look at whales as a gauge for future price fluctuations. Meanwhile, institutional investors agreed, parking nearly $8 million in ETH in the week ending Dec 23.
Furthermore, the recent fund influx negated the previous outflows, bringing the year-to-date total to $23 million in inflows.
Likely Price Target for Ethereum Token
If the recent ‘buying spree’ continues, the short-term bullish target for ETH would stand at a previous support of $2,500, or another 8% higher than the current value. However, there are also several red flags that investors should be informed about.
The relative strength index (RSI) showed a bearish divergence on the daily chart. While the price action printed higher lows, the RSI graph insisted on lower lows. Such dissonance is an indicator of an upcoming bearish reversal.
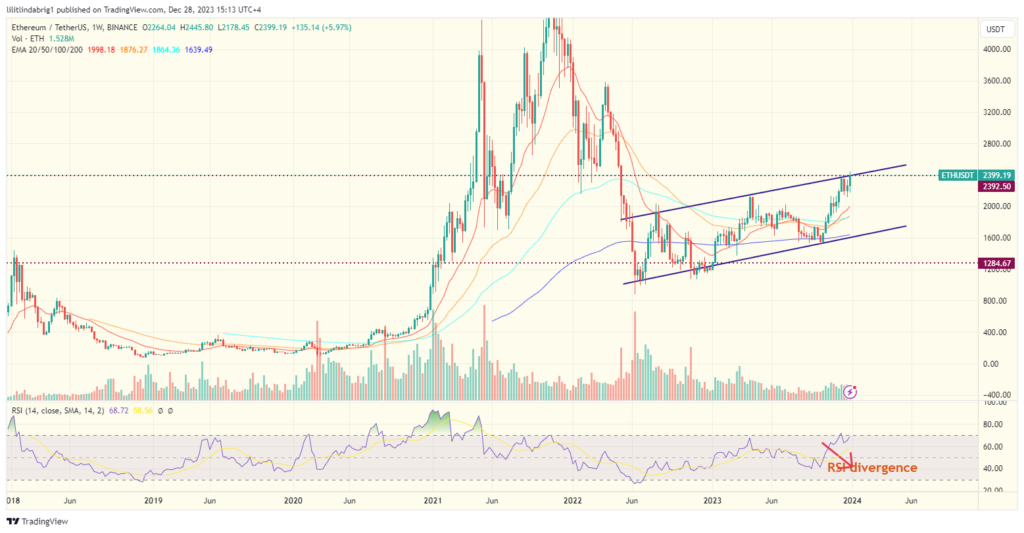
Weekly chart bearish
The Ethereum token’s weekly chart also shows that the price action arrived at a crucial resistance. ETH/USD has traded within a channel since the Terra Collapse in May 2022. The channel’s past relevance doesn’t guarantee future relevance. However, if the altcoin retests the channel’s resistance again, it could drop to the support at approximately $1,720, a 30% drop for the leading altcoin.
The post Why is Ethereum Price Up Today? appeared first on CoinChapter.


