

YEREVAN (CoinChapter.com) – Ethereum token Ether (ETH) traded at $1,570 on Jan 17, after a 33% year-to-date rally, following Bitcoin. Meanwhile, technicals flash conflicting cues on the charts as the bullish momentum slows.
ETH price charts conflicting
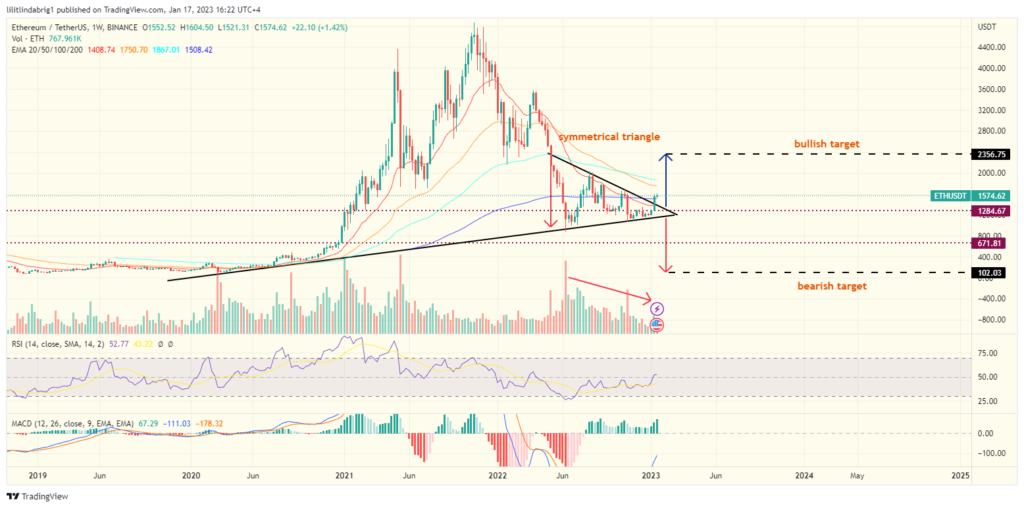
The largest altcoin by market cap has charted within a setup known as the ‘symmetrical triangle’ since May 2022. The latter entails two converging trendlines with a similar slope. They connect the swing highs and lows, gradually lowering the amplitude.
 daily price action chart.")
After confirming the pattern, the underlying asset is expected to pull off a sharp move equal to the formation’s maximal height. Notably, the symmetrical triangle is a neutral pattern that does NOT forecast a particular bias.
What to expect in the current quarter?
Ethereum token broke the pattern to the upside and could ascend another 50% to meet the target price of $2,350. However, if the market faces another downturn, an additional drop of over 90% could be in the books, taking the ETH price to around $100. The macro conditions and the ‘overbought’ relative strength index (RSI: purple graph at the bottom) back the bearish prognosis.
But, as mentioned, the crypto market has seen a relief rally lately, which could continue if the bulls double down, encouraged by dovish cues from the Federal Reserve.
As of Jan 17, the alpha altcoin traded above its 20,50,100, and 200-day exponential moving averages. Zooming out to the weekly chart also showed the heightened significance of the triangle’s support.
Also read: Ethereum Price Hesitates, But Further Gains Seem Likely.
Notably, the relative strength index on the weekly chart was undecisive, and the trading volume decline was more pronounced. Meanwhile, technicals alone are not enough for a viable prediction. Thus, a closer look at the on-chain metrics is warranted.
Ethereum on-chain metrics optimistic, but the selloff threats remain.
Ethereum has increased its DeFi market dominance since the Merge, taking it from 57 to 60%. The blockchain’s total value locked (TVL) stood at $27.1 billion on Jan 17, according to DeFiLlama.

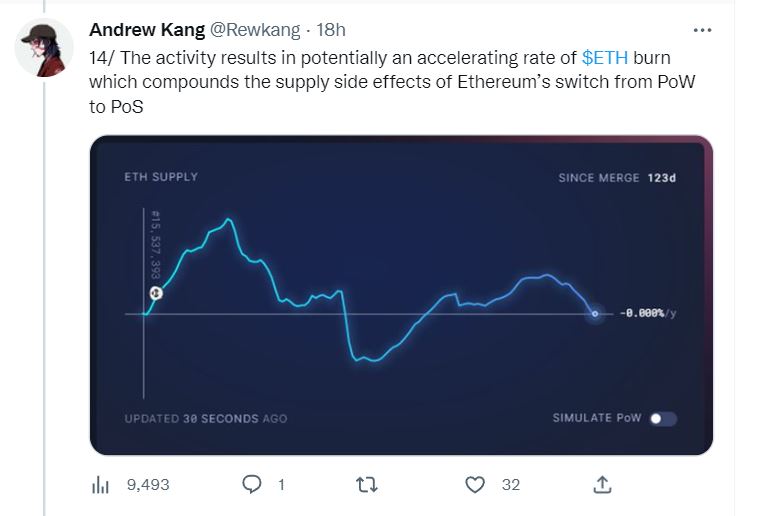
Crypto analyst Andrew Kang also had an optimistic prognosis for Ethereum gains, noting a rise in the NFT sector. He asserted that the activity in the NFT sector could boost ETH burn further.
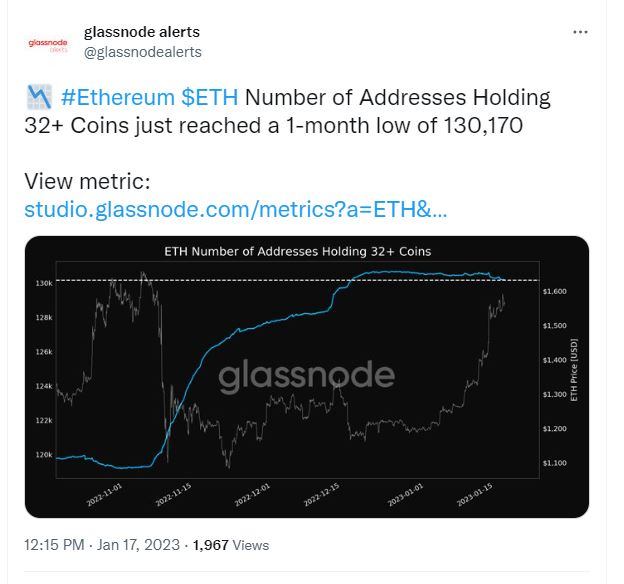
In the previous Ethereum review, CoinChapter noted an increase in shark address accumulation. However, the latest data from the analytical platform Glassnode show a slowdown. The number of accounts holding over 32 ETH declined to a month-low of 130,000.
Also read: Ethereum (ETH) Shark Addresses Accumulate despite Bearish Cues.
While all the bullish factors mentioned above are valid, the selloff threats have NOT diminished. It is crucial to watch the broader market closely, as the recent ETH price uptick was mainly due to the Bitcoin rally. Thus, if the alpha crypto dives into a reversal, the Ethereum token is likely to follow suit, paring all the Q1 gains.
The post Will Ethereum (ETH) rally another 50% in Q1 2023 or pare the recent gains? appeared first on CoinChapter.


