

The super trend indicator suggests a buy signal for XTZ, with bullies struggling to break the horizontal resistance at $3.62.
XTZ is trading around $ 3.41, down 1.1% in the last 24 hours at the time of writing, according to data from CoinGecko. The value of the wedge, however, is up 7% over the past week, with the price of Tezos still in an uptrend despite confronting this downward pressure that has limited the rise over the past five days.
The price of the cryptocurrency has rebounded from the $ 3.62 mark twice this week. This means that the presence of the bears could lead to further consolidation within the narrow upward channel.
But with Bitcoin and Ethereum in sight of new weekly highs above $ 46,000 and $ 3,200 respectively, a general rebound in the cryptocurrency market could see XTZ’s buy signal strengthen over the next few days.
Price analysis of Tezos
The technical outlook for the wedge suggests a continuation of the uptrend, unless there is a clear break that would highlight a potential invalidation of the configuration.
The RSI maintains a positive divergence above the equilibrium line, while the appearance of the green super trend signal indicates an upward movement towards intra-day highs.
This move could allow the XTZ / USD pair to move past the midline of the ascending channel, and if the gains continue, buyers may be interested in the key resistance area marked by the Fibonacci retracement level of 61.8% to $ 3.56 and the upper channel trend line.
If trading volume increases, the next target for XTZ / USD would be the pursuit towards resistance at the 78.6% Fibonacci level ($3.97). 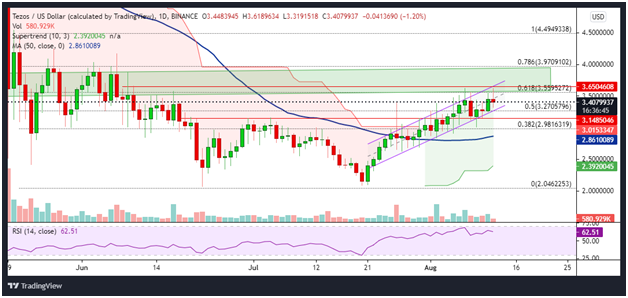
Daily chart of XTZ. Source : TradingView
On the other hand, a break under the channel support and the Fib level at 50% ($3.27) could prompt sellers to aim for a re-test of the support line at $3.15. The Fibonacci level of 38.2% ($2.98) could offer temporary relief.
However, below this anchor point, the bulls will have to defend the 50 SMA ($2.86) to prevent further declines to $2.36.


